Perceptual survey (ISO 12913-2)
Everything else in the toolbox measures a soundscape; the survey command
asks people. It ingests ISO 12913-2 Method A questionnaire responses —
the eight perceived affective qualities pleasant, chaotic, vibrant,
uneventful, calm, annoying, eventful, monotonous — and projects them onto
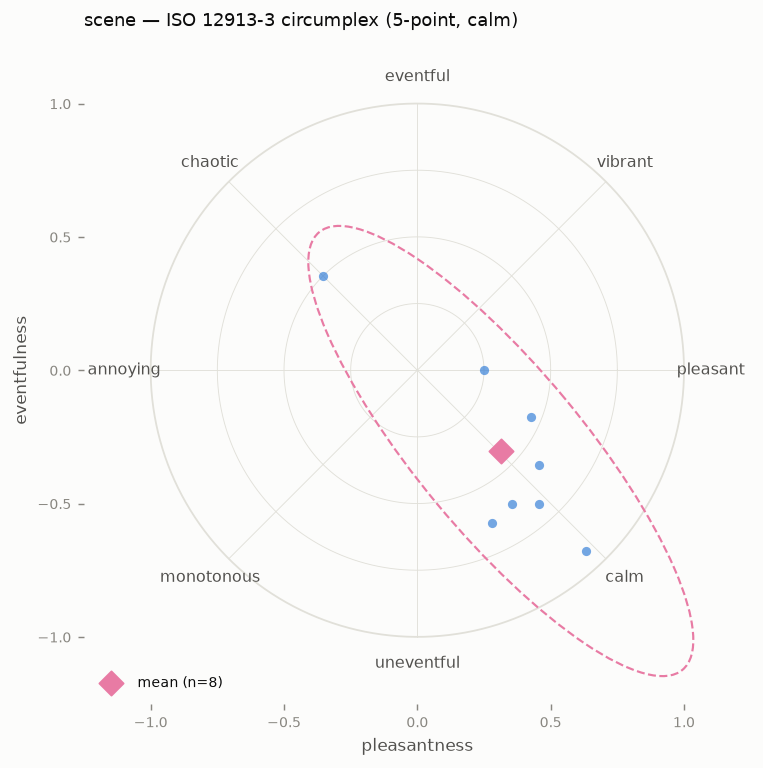
the ISO/TS 12913-3 two-dimensional circumplex:
Pleasantness = (p − a) + cos45°·(ca − ch) + cos45°·(v − m)
Eventfulness = (e − u) + cos45°·(ch − ca) + cos45°·(v − m)
normalised to [−1, +1], with the familiar quadrant labels: vibrant (+P, +E), chaotic (−P, +E), monotonous (−P, −E), calm (+P, −E).
ambiscape survey SESSION/ --responses responses.csv
#   12 respondent(s) (5-point): pleasantness +0.512, eventfulness -0.488
#   -> calm quadrant, dispersion 0.14
#   | measured | value | perceived | value |
#   |---|---|---|---|
#   | LAeq (dBFS) | -38.2 | pleasantness | +0.512 |
#   | events/min | 1.2 | eventfulness | -0.488 |
#   wrote SESSION/analysis/survey.json, survey.png; srv_ keys merged into summary.json
-o picks the output directory (default SESSION/analysis).
The response CSV
One row per respondent; the eight scale names as columns
(case-insensitive, any order). The coded scale is auto-detected: values
within 1–5 read as the printed 5-point Likert form, anything larger as
the 0–100 digital slider — both normalise to the same circumplex. A
respondent/participant/id/subject column (if present) names the
rows; extra columns such as appropriateness or loudness ratings ride
along into survey.json, with numeric ones averaged into the summary.
Rows with a missing scale value are skipped and counted.
respondent,pleasant,chaotic,vibrant,uneventful,calm,annoying,eventful,monotonous,loudness
anna,5,1,2,4,5,1,1,2,30
berit,4,1,2,4,4,2,2,2,40
Outputs
survey.png— the circumplex: one point per respondent, the mean as a diamond, and the 95% covariance ellipse of the respondent cloud (drawn for n ≥ 3).survey.json— per-respondent coordinates and raw ratings, mean, SD, dispersion (RMS distance from the mean point), quadrant, ellipse parameters, and extras.summary.jsongainssrv_-prefixed keys (srv_n,srv_pleasantness_mean,srv_eventfulness_mean,srv_dispersion,srv_quadrant, SDs) — the same join as thevis_keys from the vision module — soambiscape catalogranks a corpus perceptually next to the acoustic descriptors:
ambiscape catalog CORPUS/ --sort srv_pleasantness_mean
When the session already has an acoustic summary.json (from
analyze), the command also prints a short perception-vs-measurement
table pairing each available descriptor with the coordinate it is
classically regressed against — LAeq, L90, and NDSI vs pleasantness,
event rate vs eventfulness — and stores the rows in survey.json under
vs_measurement. That is the dose–response view in miniature: does the
quieter session actually feel more pleasant?
In a notebook
from ambiscape import survey

r = survey.read_responses("responses.csv")     # scale auto-detected
doc = survey.summarize(r)                      # points, mean, ellipse
survey.coordinates({"pleasant": 5, ...})       # one respondent -> (P, E)
survey.run_survey("SESSION/", "responses.csv") # files + summary join
Protocol vs software
This closes the data-handling half of ISO 12913-2: collection remains a protocol matter (soundwalk design, instruction wording, translation of the scale labels). As with the psychoacoustic indicators, the honest claim is "12913-2-informed collection, 12913-3 analysis", with the protocol documented alongside the numbers.