Skip to content

Annotation views

Figures that know about annotations: filmstrip, concordance, tier map, structure map.

Every other way this toolbox has of looking at a long recording is about the signal. Hierarchy and the ELAN exporter sit on the other side of a gap almost nothing crosses, and for somebody annotating hours of video that crossing is the tool.

tier_map—where is there anything to look at

Tier map

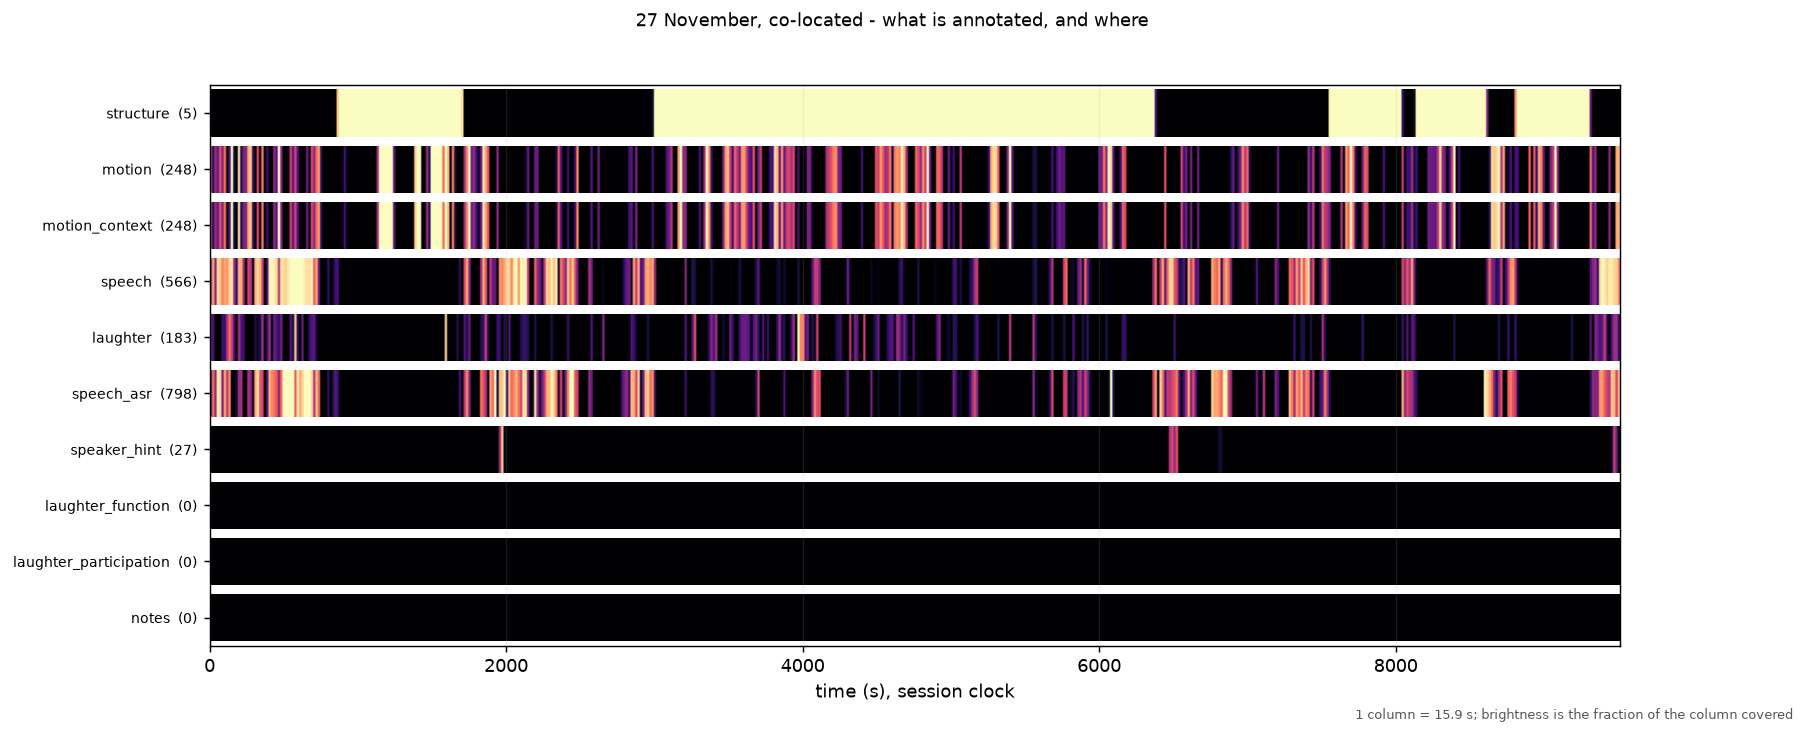
Every tier as a density band across the recording. Brightness is the fraction of each column covered. Empty tiers are drawn as empty bands rather than omitted, because noticing what has not been annotated is half of what the view is for.

concordance—every instance of one category, side by side

Concordance

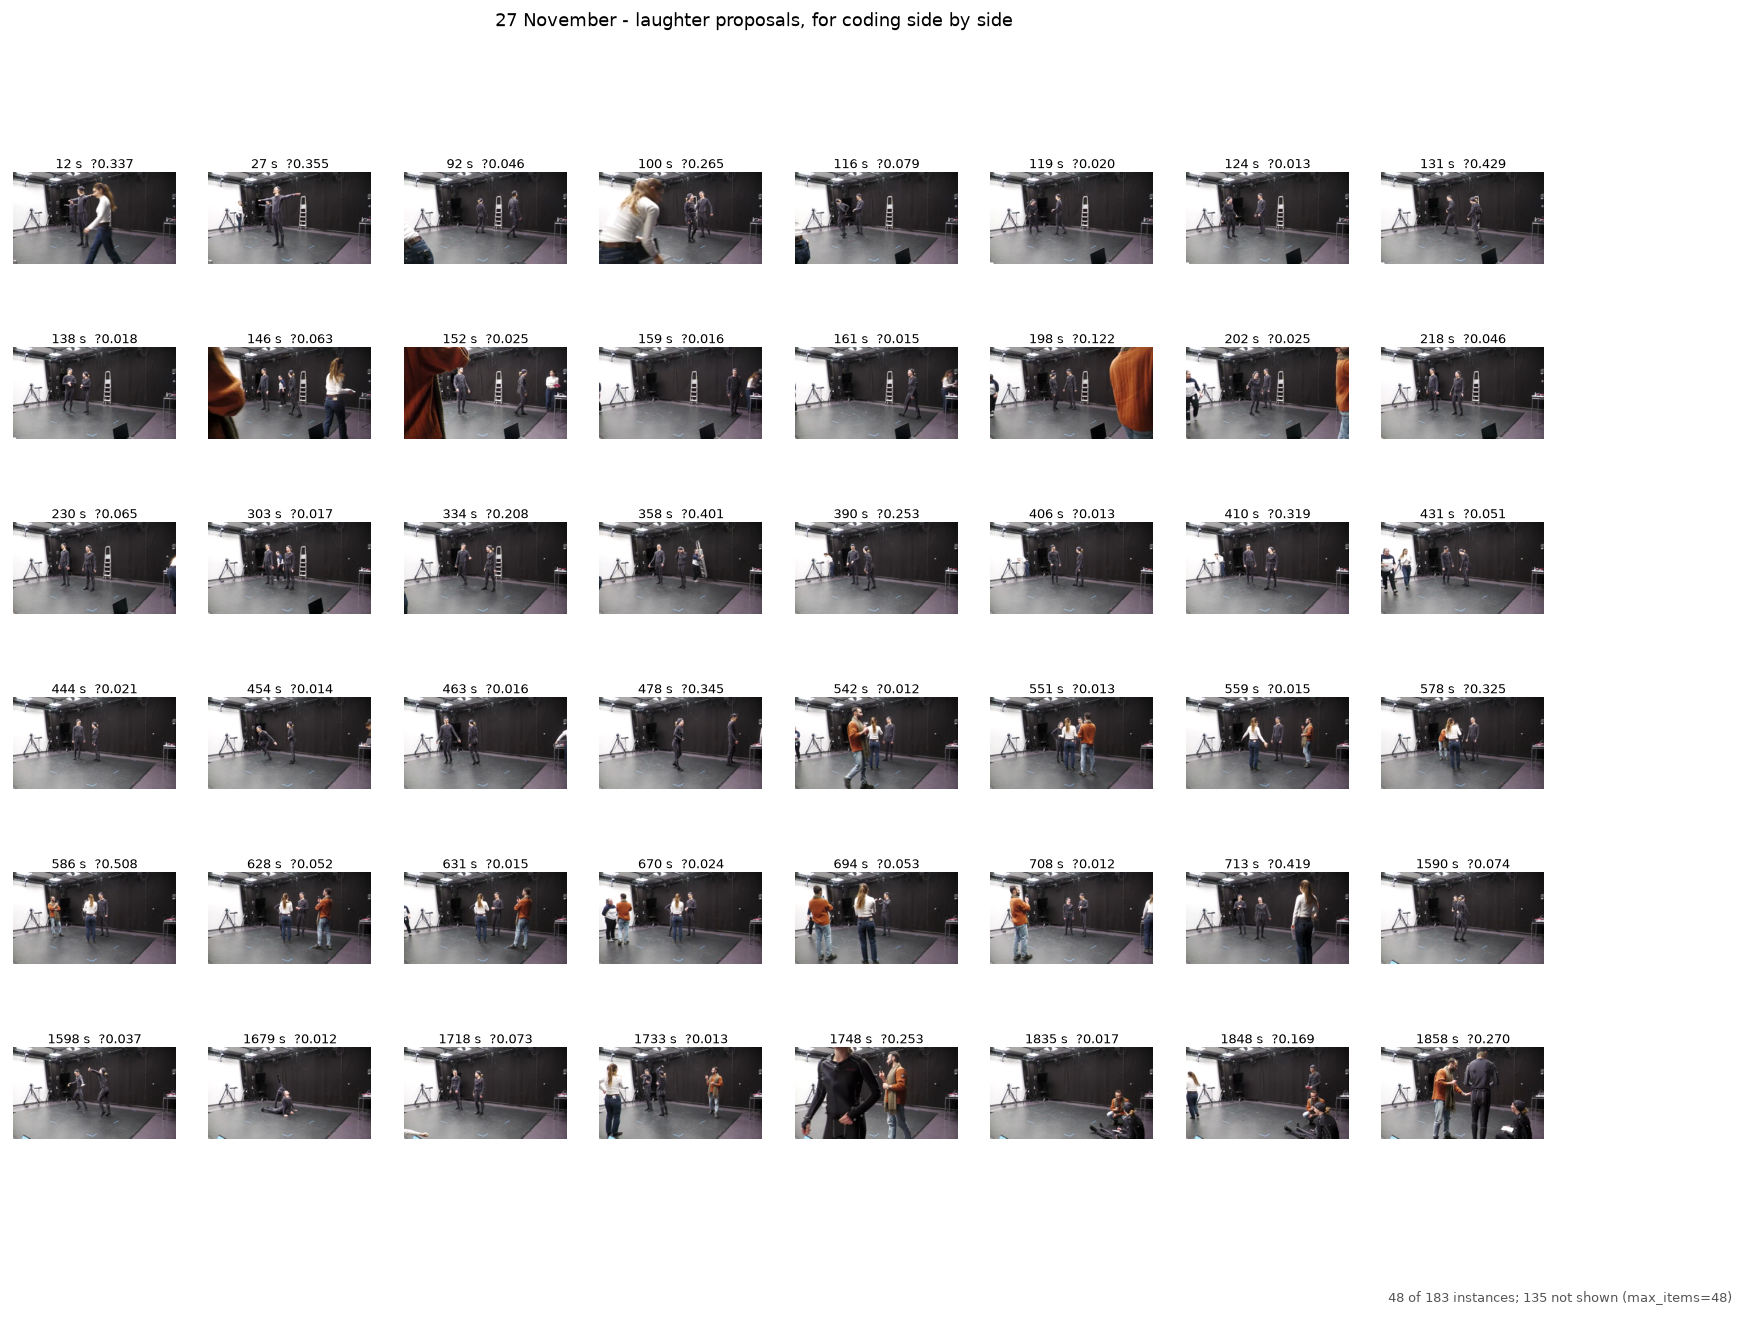
The linguist's concordance applied to video. Coding 183 proposals one at a time, hours apart, is how a category drifts; seeing them together is how it does not. What the cap left out is stated on the figure, never silently.

filmstrip—what is actually happening here

Filmstrip

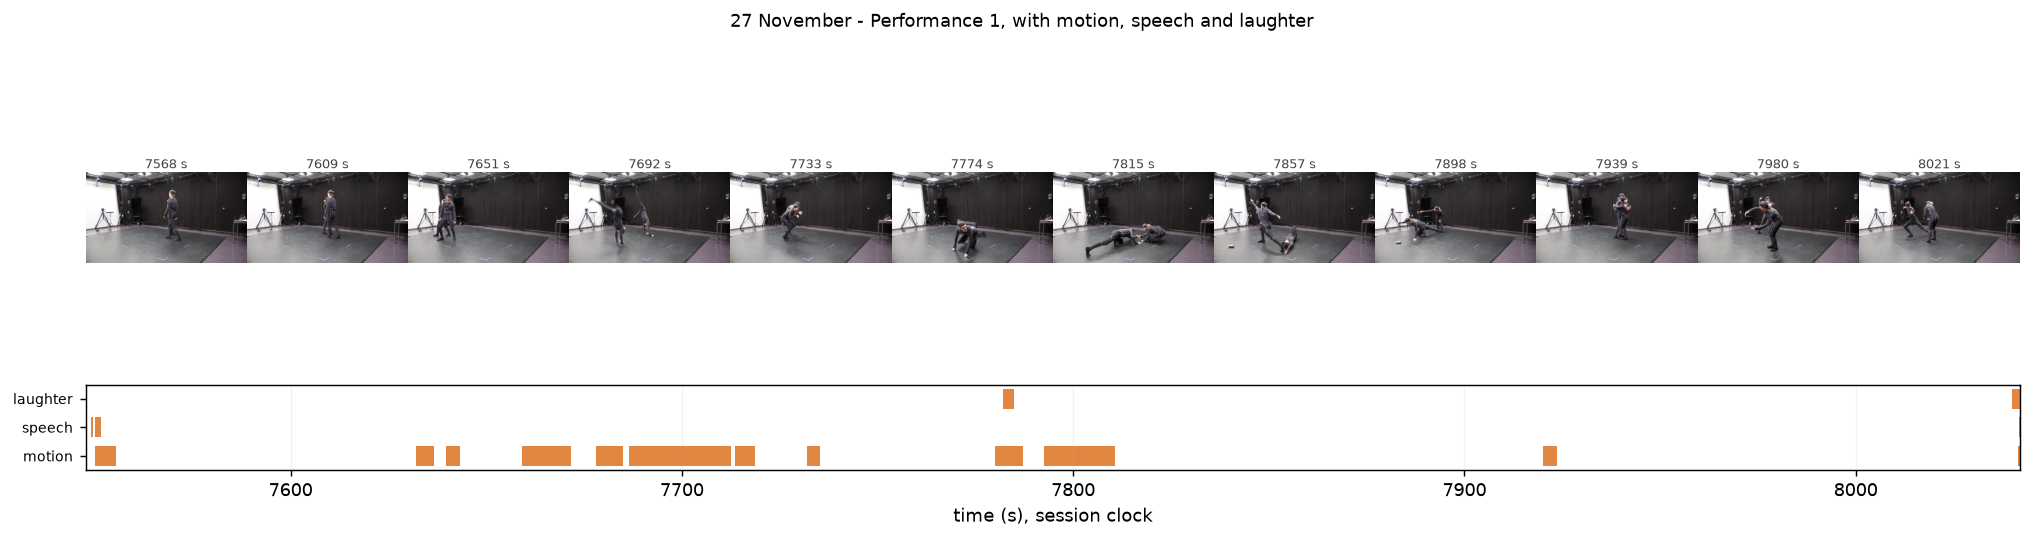
Keyframes on the time axis with the annotation tiers beneath them, pinned to the same x-limits so a frame is never drawn above a span it does not belong to.

structure_map—where a recording repeats itself

Structure map

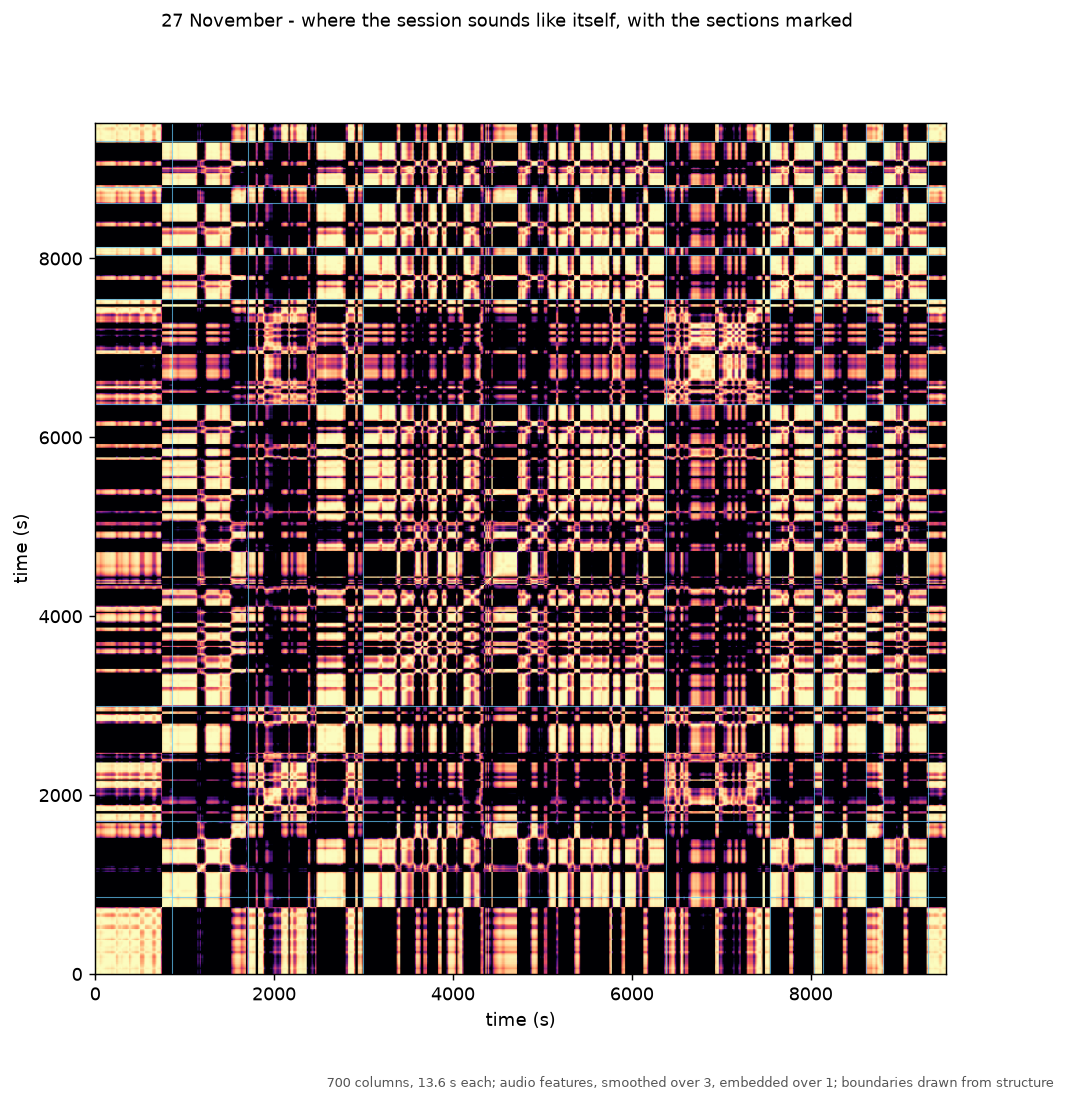
A self-similarity matrix with somebody's coding drawn on it. Read its warning before using it: its defaults are measured, not assumed, and video features failed on the corpus it was written for.

Figures that know about annotations, which none of the toolbox's others do.

MGT already has a rich battery of ways to look at a long recording --- motiongrams, videograms, self-similarity, tempograms, contact sheets, heatmaps, stroboscopes --- and every one of them is about the signal. Hierarchy and the ELAN exporter live on the other side of a gap that almost nothing crosses. For somebody annotating two and a half hours, that crossing is the tool, and these are the four views that make it.

They correspond to what the three fields that use this material actually do:

  • filmstrip --- keyframes laid along the time axis under the annotation tiers. Human movement science reduces the spatial dimension so time becomes visible; this reduces it the other way, keeping enough picture to answer "what is happening here" without scrubbing.
  • concordance --- every instance of one category side by side. This is the linguist's concordance applied to video, and it is what makes 183 laughter proposals codable consistently rather than one at a time, hours apart.
  • tier_map --- every tier as a density band over the whole session. The "where is there anything to look at" view, and the one that shows which tiers are still empty.
  • structure_map --- a self-similarity matrix with the annotation boundaries drawn on it. Music and movement structure analysis uses SSMs to find repeated material; drawing someone's coding on top asks whether their boundaries and the repetition agree. Read its warning before using it: it did not work on the corpus it was written for.

Split the way _voice is split. The parts with a right answer --- which frames to sample, how a grid is shaped, how full a tier is, where a time falls in a matrix --- are the functions below and are tested. Rendering is a thin layer over them.

sample_times

sample_times(start_s, end_s, n)

n times spread across a span, kept strictly inside it.

Inside, not on the edges: a frame at exactly the end of a clip may not exist, and one just inside always does. With n = 1 the time is the middle, which is the frame a person would pick to represent a span.

Parameters:

Name Type Description Default
start_s float

Start of the span.

required
end_s float

End of the span. May equal start_s; a detector can emit a degenerate span and asking for frames from it should still work.

required
n int

How many times to return.

required

Returns:

Name Type Description
list list[float]

The times, ascending. Empty when n is not positive.

Source code in musicalgestures/_views.py
35
36
37
38
39
40
41
42
43
44
45
46
47
48
49
50
51
52
53
54
55
56
57
def sample_times(start_s: float, end_s: float, n: int) -> list[float]:
    """`n` times spread across a span, kept strictly inside it.

    Inside, not on the edges: a frame at exactly the end of a clip may not exist, and one
    just inside always does. With `n = 1` the time is the middle, which is the frame a
    person would pick to represent a span.

    Args:
        start_s (float): Start of the span.
        end_s (float): End of the span. May equal `start_s`; a detector can emit a
            degenerate span and asking for frames from it should still work.
        n (int): How many times to return.

    Returns:
        list: The times, ascending. Empty when `n` is not positive.
    """
    if n <= 0:
        return []
    span = float(end_s) - float(start_s)
    if span <= 0:
        return [float(start_s)] * n
    #: Midpoints of n equal slices: evenly spaced, and never on either edge.
    return [float(start_s) + span * (i + 0.5) / n for i in range(n)]

grid_shape

grid_shape(n_items, n_cols=None)

Rows and columns for a grid of n_items.

Without a column count, as square as it can be and never taller than wide: a concordance is read across, and a tall narrow grid puts the instances a reader is comparing far apart on the page.

Parameters:

Name Type Description Default
n_items int

How many cells are needed.

required
n_cols int

Columns to use, or None to choose.

None

Returns:

Name Type Description
tuple tuple[int, int]

(rows, columns). The last row may be partial; nothing is dropped.

Source code in musicalgestures/_views.py
60
61
62
63
64
65
66
67
68
69
70
71
72
73
74
75
76
77
78
79
80
81
82
def grid_shape(n_items: int, n_cols: int | None = None) -> tuple[int, int]:
    """Rows and columns for a grid of `n_items`.

    Without a column count, as square as it can be and never taller than wide: a
    concordance is read across, and a tall narrow grid puts the instances a reader is
    comparing far apart on the page.

    Args:
        n_items (int): How many cells are needed.
        n_cols (int): Columns to use, or None to choose.

    Returns:
        tuple: (rows, columns). The last row may be partial; nothing is dropped.
    """
    n = max(0, int(n_items))
    if n == 0:
        return (0, 0)
    if n_cols:
        cols = int(n_cols)
    else:
        cols = int(np.ceil(np.sqrt(n)))
    rows = int(np.ceil(n / cols))
    return (rows, cols)

tier_density

tier_density(spans, duration_s, n_bins)

What fraction of each time bin a tier covers.

Overlapping spans are merged first, so a bin cannot be more than full. Detectors emit touching and overlapping spans routinely, and a density above 1 is not a stronger signal, it is a broken one.

An empty tier returns zeros rather than an empty array, because an empty tier still has to be drawn: seeing which tiers are not yet filled is half of what this view is for.

Parameters:

Name Type Description Default
spans

Actions, in any order.

required
duration_s float

Length of the recording.

required
n_bins int

How many bins to divide it into.

required

Returns:

Type Description
ndarray

np.ndarray: One fraction in [0, 1] per bin.

Source code in musicalgestures/_views.py
 85
 86
 87
 88
 89
 90
 91
 92
 93
 94
 95
 96
 97
 98
 99
100
101
102
103
104
105
106
107
108
109
110
111
112
113
114
115
116
117
118
119
120
121
122
123
124
125
126
127
128
129
def tier_density(spans, duration_s: float, n_bins: int) -> np.ndarray:
    """What fraction of each time bin a tier covers.

    Overlapping spans are merged first, so a bin cannot be more than full. Detectors emit
    touching and overlapping spans routinely, and a density above 1 is not a stronger
    signal, it is a broken one.

    An empty tier returns zeros rather than an empty array, because an empty tier still
    has to be drawn: seeing which tiers are not yet filled is half of what this view is for.

    Args:
        spans: Actions, in any order.
        duration_s (float): Length of the recording.
        n_bins (int): How many bins to divide it into.

    Returns:
        np.ndarray: One fraction in [0, 1] per bin.
    """
    n_bins = max(1, int(n_bins))
    out = np.zeros(n_bins)
    if duration_s <= 0:
        return out
    width = duration_s / n_bins

    pairs = sorted((float(s.start), float(s.end)) for s in spans or [])
    merged: list[list[float]] = []
    for a, b in pairs:
        if b <= a:
            continue
        if merged and a <= merged[-1][1]:
            merged[-1][1] = max(merged[-1][1], b)
        else:
            merged.append([a, b])

    for a, b in merged:
        first = max(0, int(a / width))
        last = min(n_bins - 1, int(np.ceil(b / width)) - 1)
        for i in range(first, last + 1):
            lo, hi = i * width, (i + 1) * width
            out[i] += max(0.0, min(b, hi) - max(a, lo))
    #: No clamp here. After merging, the spans are disjoint and no bin can exceed its
    #: own width, so a clamp would be unreachable --- and worse, it would hide a broken
    #: merge by quietly returning 1.0 instead of the 1.6 that would expose it.
    density: np.ndarray = out / width
    return density

time_to_index

time_to_index(t, duration_s, n)

Where a time falls in an n-element series over duration_s.

Clamped, never wrapped. Annotations shifted from another recording's clock can land outside this one, and a wrapped index puts a boundary at the start of the session where it looks entirely plausible. Clamping puts it at the edge, where it looks wrong.

Parameters:

Name Type Description Default
t float

The time, in seconds.

required
duration_s float

Length the series covers.

required
n int

Number of elements.

required

Returns:

Name Type Description
int int

An index in [0, n-1].

Source code in musicalgestures/_views.py
132
133
134
135
136
137
138
139
140
141
142
143
144
145
146
147
148
149
150
151
152
def time_to_index(t: float, duration_s: float, n: int) -> int:
    """Where a time falls in an `n`-element series over `duration_s`.

    **Clamped, never wrapped.** Annotations shifted from another recording's clock can land
    outside this one, and a wrapped index puts a boundary at the start of the session where
    it looks entirely plausible. Clamping puts it at the edge, where it looks wrong.

    Args:
        t (float): The time, in seconds.
        duration_s (float): Length the series covers.
        n (int): Number of elements.

    Returns:
        int: An index in [0, n-1].
    """
    if n <= 0:
        return 0
    if duration_s <= 0:
        return 0
    i = int(float(t) / float(duration_s) * n)
    return max(0, min(n - 1, i))

filmstrip

filmstrip(video, start_s, end_s, n=12, hierarchy=None, levels=(), out=None, height=180, title=None)

Keyframes along the time axis, with the annotation tiers beneath them.

Answers "what is actually happening here" without scrubbing. The frames are sampled strictly inside the span and their exact times go in the sidecar, so a picture can always be traced back to a moment in the recording.

Parameters:

Name Type Description Default
video

Path to the video.

required
start_s float), end_s (float

The span to cover.

required
n int

How many frames. Defaults to 12.

12
hierarchy

A Hierarchy whose levels are drawn as bands beneath, or None.

None
levels tuple

Which levels to draw. Empty means all of them.

()
out

Output path.

None
height int

Frame height in pixels. Defaults to 180.

180
title

Figure title.

None

Returns:

Name Type Description
Path

The image written.

Source code in musicalgestures/_views.py
191
192
193
194
195
196
197
198
199
200
201
202
203
204
205
206
207
208
209
210
211
212
213
214
215
216
217
218
219
220
221
222
223
224
225
226
227
228
229
230
231
232
233
234
235
236
237
238
239
240
241
242
243
244
245
246
247
248
249
250
251
252
253
254
255
256
257
258
259
260
261
262
263
def filmstrip(video, start_s: float, end_s: float, n: int = 12, hierarchy=None,
              levels=(), out=None, height: int = 180, title=None):
    """Keyframes along the time axis, with the annotation tiers beneath them.

    Answers "what is actually happening here" without scrubbing. The frames are sampled
    strictly inside the span and their exact times go in the sidecar, so a picture can
    always be traced back to a moment in the recording.

    Args:
        video: Path to the video.
        start_s (float), end_s (float): The span to cover.
        n (int): How many frames. Defaults to 12.
        hierarchy: A `Hierarchy` whose levels are drawn as bands beneath, or None.
        levels (tuple): Which levels to draw. Empty means all of them.
        out: Output path.
        height (int): Frame height in pixels. Defaults to 180.
        title: Figure title.

    Returns:
        Path: The image written.
    """
    import matplotlib
    matplotlib.use("Agg", force=False)
    import matplotlib.pyplot as plt
    from pathlib import Path

    times = sample_times(start_s, end_s, n)
    frames = _grab(video, times, height)
    names = list(levels) if levels else (list(hierarchy.levels) if hierarchy else [])

    fig = plt.figure(figsize=(min(24, 1.6 * max(1, n)), 3.2 + 0.28 * len(names)))
    gs = fig.add_gridspec(2, 1, height_ratios=[3.0, max(0.5, 0.28 * len(names))],
                          hspace=0.08)
    top = fig.add_subplot(gs[0])
    #: The frames must sit exactly above the times they were taken at. Default axes
    #: margins would shift the strip a few per cent against the tier bands below, and a
    #: frame drawn above a span it does not belong to is a silent error --- nothing on the
    #: figure would reveal it.
    top.set_xlim(0.0, 1.0)
    top.set_ylim(0.0, 1.0)
    top.margins(0)
    top.axis("off")
    for i, (t, im) in enumerate(zip(times, frames)):
        ax = top.inset_axes([i / max(1, n), 0.0, 1 / max(1, n), 1.0])
        ax.axis("off")
        if im is not None:
            ax.imshow(im)
        ax.set_title(f"{t:.0f} s", fontsize=7, color="#444444", pad=2)

    bot = fig.add_subplot(gs[1])
    for row, name in enumerate(names):
        for a in hierarchy.levels.get(name, []):
            if a.end <= start_s or a.start >= end_s:
                continue
            bot.barh(row, min(a.end, end_s) - max(a.start, start_s),
                     left=max(a.start, start_s), height=0.7,
                     color="#d95f02", alpha=0.75, linewidth=0)
    bot.set_yticks(range(len(names)))
    bot.set_yticklabels(names, fontsize=8)
    bot.set_xlim(start_s, end_s)
    bot.margins(x=0)
    bot.set_xlabel("time (s), session clock")
    bot.grid(axis="x", alpha=0.15)
    fig.suptitle(title or f"{Path(video).name}  {start_s:.0f}-{end_s:.0f} s", fontsize=10)

    out = Path(out) if out else Path(f"filmstrip_{int(start_s):06d}.png")
    fig.savefig(out, bbox_inches="tight", dpi=130)
    plt.close(fig)
    _sidecar(out, {"image": out.name, "start_s": start_s, "end_s": end_s,
                   "frame_times_s": [round(t, 3) for t in times],
                   "levels": names,
                   "note": "frames are sampled strictly inside the span, at the times listed"})
    return out

concordance

concordance(video, spans, out, n_cols=None, label_key=None, height=150, title=None, max_items=60)

Every instance of one category, side by side.

The linguist's concordance applied to video. Coding 183 laughter proposals one at a time, hours apart, is how a category drifts; seeing them together is how it does not.

Parameters:

Name Type Description Default
video

Path to the video.

required
spans

The Actions to show, in any order; they are sorted by time.

required
out

Output path.

required
n_cols int

Columns, or None to choose a near-square layout.

None
label_key str

Which label to print under each frame, or None for the time.

None
height int

Frame height in pixels.

150
title

Figure title.

None
max_items int

Cap, so a category with thousands of instances does not silently produce an unreadable figure. What was dropped is stated on the figure and in the sidecar, never silently.

60

Returns:

Name Type Description
Path

The image written.

Source code in musicalgestures/_views.py
266
267
268
269
270
271
272
273
274
275
276
277
278
279
280
281
282
283
284
285
286
287
288
289
290
291
292
293
294
295
296
297
298
299
300
301
302
303
304
305
306
307
308
309
310
311
312
313
314
315
316
317
318
319
320
321
322
323
def concordance(video, spans, out, n_cols=None, label_key=None, height: int = 150,
                title=None, max_items: int = 60):
    """Every instance of one category, side by side.

    The linguist's concordance applied to video. Coding 183 laughter proposals one at a
    time, hours apart, is how a category drifts; seeing them together is how it does not.

    Args:
        video: Path to the video.
        spans: The Actions to show, in any order; they are sorted by time.
        out: Output path.
        n_cols (int): Columns, or None to choose a near-square layout.
        label_key (str): Which label to print under each frame, or None for the time.
        height (int): Frame height in pixels.
        title: Figure title.
        max_items (int): Cap, so a category with thousands of instances does not silently
            produce an unreadable figure. **What was dropped is stated on the figure and
            in the sidecar**, never silently.

    Returns:
        Path: The image written.
    """
    import matplotlib
    matplotlib.use("Agg", force=False)
    import matplotlib.pyplot as plt
    from pathlib import Path

    items = sorted(spans, key=lambda a: a.start)
    shown, dropped = items[:max_items], max(0, len(items) - max_items)
    rows, cols = grid_shape(len(shown), n_cols)
    if rows == 0:
        rows, cols = 1, 1

    times = [sample_times(a.start, a.end, 1)[0] for a in shown]
    frames = _grab(video, times, height)

    fig, axes = plt.subplots(rows, cols, figsize=(1.9 * cols, 1.7 * rows))
    axes = np.atleast_1d(axes).ravel()
    for ax in axes:
        ax.axis("off")
    for ax, a, t, im in zip(axes, shown, times, frames):
        if im is not None:
            ax.imshow(im)
        lab = a.labels.get(label_key, "") if label_key else ""
        ax.set_title(f"{t:.0f} s" + (f"  {lab}" if lab else ""), fontsize=7, pad=2)

    note = f"{len(shown)} of {len(items)} instances"
    if dropped:
        note += f"; {dropped} not shown (max_items={max_items})"
    fig.suptitle(title or note, fontsize=10)
    fig.text(0.995, 0.005, note, ha="right", va="bottom", fontsize=7, color="#555555")
    out = Path(out)
    fig.savefig(out, bbox_inches="tight", dpi=130)
    plt.close(fig)
    _sidecar(out, {"image": out.name, "n_total": len(items), "n_shown": len(shown),
                   "n_dropped": dropped, "max_items": max_items,
                   "times_s": [round(t, 3) for t in times]})
    return out

tier_map

tier_map(hierarchy, duration_s, out, n_bins=600, title=None)

Every tier as a density band over the whole recording.

The "where is there anything to look at" view, and the one that shows which tiers are still empty --- an empty tier is drawn as an empty band rather than omitted, because noticing what has not been annotated is half of what this is for.

Parameters:

Name Type Description Default
hierarchy

The levels to draw.

required
duration_s float

Length of the recording.

required
out

Output path.

required
n_bins int

Horizontal resolution. Defaults to 600.

600
title

Figure title.

None

Returns:

Name Type Description
Path

The image written.

Source code in musicalgestures/_views.py
326
327
328
329
330
331
332
333
334
335
336
337
338
339
340
341
342
343
344
345
346
347
348
349
350
351
352
353
354
355
356
357
358
359
360
361
362
363
364
365
366
367
368
369
370
371
def tier_map(hierarchy, duration_s: float, out, n_bins: int = 600, title=None):
    """Every tier as a density band over the whole recording.

    The "where is there anything to look at" view, and the one that shows which tiers are
    still empty --- an empty tier is drawn as an empty band rather than omitted, because
    noticing what has not been annotated is half of what this is for.

    Args:
        hierarchy: The levels to draw.
        duration_s (float): Length of the recording.
        out: Output path.
        n_bins (int): Horizontal resolution. Defaults to 600.
        title: Figure title.

    Returns:
        Path: The image written.
    """
    import matplotlib
    matplotlib.use("Agg", force=False)
    import matplotlib.pyplot as plt
    from pathlib import Path

    names = list(hierarchy.levels)
    dens = {n: tier_density(hierarchy.levels[n], duration_s, n_bins) for n in names}

    fig, ax = plt.subplots(figsize=(14, 0.42 * max(1, len(names)) + 1.4))
    for row, name in enumerate(names):
        ax.imshow(dens[name][None, :], aspect="auto", cmap="magma", vmin=0, vmax=1,
                  extent=(0, duration_s, row - 0.42, row + 0.42))
    ax.set_ylim(len(names) - 0.5, -0.5)
    ax.set_yticks(range(len(names)))
    ax.set_yticklabels([f"{n}  ({len(hierarchy.levels[n])})" for n in names], fontsize=8)
    ax.set_xlim(0, duration_s)
    ax.set_xlabel("time (s), session clock")
    ax.grid(axis="x", alpha=0.15)
    fig.suptitle(title or "annotation density by tier", fontsize=10)
    fig.text(0.995, 0.005, f"1 column = {duration_s / n_bins:.1f} s; "
                           f"brightness is the fraction of the column covered",
             ha="right", va="bottom", fontsize=7, color="#555555")
    out = Path(out)
    fig.savefig(out, bbox_inches="tight", dpi=130)
    plt.close(fig)
    _sidecar(out, {"image": out.name, "duration_s": duration_s, "n_bins": n_bins,
                   "tiers": {n: len(hierarchy.levels[n]) for n in names},
                   "seconds_per_column": duration_s / n_bins})
    return out

structure_map

structure_map(analysis_dir, duration_s, out, hierarchy=None, levels=(), max_columns=700, which='videogram_v', title=None, embed=None, smooth=None, features='audio', audio=None, n_mfcc=20)

A self-similarity matrix with somebody's annotation boundaries drawn on it.

Music and movement structure analysis uses self-similarity to find repeated material. Drawing a coding on top asks whether the boundaries somebody marked and the repetition the signal shows agree.

Use audio features unless you have a reason not to. That is the default, and the reason is measured. On this toolbox's dance corpus, where one session contains three performances of the same devised material, a usable feature should make those three resemble each other more than they resemble the rehearsal. Mean cosine separation:

=========================== ========== feature separation =========================== ========== chroma +0.252 spectral contrast +0.242 MFCC +0.234 videogram columns +0.029 hand-built activity profile -0.007 =========================== ==========

.. warning::

The video features did not work on the corpus this was written for, and the failure is in the features rather than in the drawing. A known-answer test is available there: one session contains three performances of the same devised material, so any usable feature should make those three resemble each other more than they resemble the rehearsal. Two were tried at 400 columns over 2 h 38 m. Videogram columns separated them by +0.029 in mean cosine similarity, which is nothing; a hand-built activity profile --- level, spread, burstiness and the envelope's own spectrum per block --- separated them by -0.007, the wrong way.

The reason is visible once stated: a videogram column encodes where in the frame the motion was, and over hours that mostly tracks where the dancers are standing. It is a position signal, and smoothing and time-delay embedding do not turn a position signal into a structure signal.

So features="videogram" is kept for material where the frame does carry structure, and it is not the default. Whichever you use, check it against something you already know before believing a figure: a self-similarity matrix always produces a plausible-looking picture, which is exactly what makes it dangerous.

Parameters:

Name Type Description Default
analysis_dir

Directory holding the cached pyramid.

required
duration_s float

Length of the recording.

required
out

Output path.

required
hierarchy

A Hierarchy whose boundaries are drawn, or None.

None
levels tuple

Which levels to draw. Empty means all.

()
max_columns int

Resolution of the matrix. Defaults to 700.

700
which str

Which pyramid to read. Defaults to "videogram_v".

'videogram_v'
title

Figure title.

None
embed int

Time-delay embedding: how many consecutive columns are stacked into each feature vector, so a vector describes a short passage rather than an instant. Defaults depend on the feature, because what rescues one handicaps the other. Videogram columns need it badly --- without it the matrix is one broad diagonal with no blocks --- so the default there is 12. MFCCs already describe a window's spectral envelope, and stacking dilutes them: on the corpus this was written for, embedding and smoothing cut the measured separation from +0.259 to +0.142. So the audio default is 1, meaning none.

None
smooth int

Columns to average before embedding. 9 for videogram; 3 for audio, which is the knee of a two-criterion sweep --- it keeps essentially all of the discrimination (+0.257 of a possible +0.259) while raising local coherence from 0.48 to 0.76, which is the difference between a readable figure and a mess of stripes.

None
features str

"audio" for MFCCs, which is the default and the one that was measured to work, or "videogram" for the cached pyramid.

'audio'
audio

Path to a WAV for features="audio". Defaults to audio16k.wav beside the analysis directory.

None
n_mfcc int

How many MFCCs. Defaults to 20.

20

Returns:

Name Type Description
Path

The image written.

Source code in musicalgestures/_views.py
374
375
376
377
378
379
380
381
382
383
384
385
386
387
388
389
390
391
392
393
394
395
396
397
398
399
400
401
402
403
404
405
406
407
408
409
410
411
412
413
414
415
416
417
418
419
420
421
422
423
424
425
426
427
428
429
430
431
432
433
434
435
436
437
438
439
440
441
442
443
444
445
446
447
448
449
450
451
452
453
454
455
456
457
458
459
460
461
462
463
464
465
466
467
468
469
470
471
472
473
474
475
476
477
478
479
480
481
482
483
484
485
486
487
488
489
490
491
492
493
494
495
496
497
498
499
500
501
502
503
504
505
506
507
508
509
510
511
512
513
514
515
516
517
518
519
520
521
522
523
524
525
526
527
528
529
530
531
532
533
534
535
536
537
538
539
540
541
542
543
544
545
546
def structure_map(analysis_dir, duration_s: float, out, hierarchy=None, levels=(),
                  max_columns: int = 700, which: str = "videogram_v", title=None,
                  embed: int | None = None, smooth: int | None = None,
                  features: str = "audio", audio=None, n_mfcc: int = 20):
    """A self-similarity matrix with somebody's annotation boundaries drawn on it.

    Music and movement structure analysis uses self-similarity to find repeated material.
    Drawing a coding on top asks whether the boundaries somebody marked and the repetition
    the signal shows agree.

    **Use audio features unless you have a reason not to.** That is the default, and the
    reason is measured. On this toolbox's dance corpus, where one session contains three
    performances of the same devised material, a usable feature should make those three
    resemble each other more than they resemble the rehearsal. Mean cosine separation:

    ===========================  ==========
    feature                      separation
    ===========================  ==========
    chroma                          +0.252
    spectral contrast               +0.242
    MFCC                            +0.234
    videogram columns               +0.029
    hand-built activity profile     -0.007
    ===========================  ==========

    .. warning::

       **The video features did not work on the corpus this was written for, and the
       failure is in the features rather than in the drawing.** A known-answer test is available there:
       one session contains three performances of the same devised material, so any usable
       feature should make those three resemble each other more than they resemble the
       rehearsal. Two were tried at 400 columns over 2 h 38 m. Videogram columns separated
       them by +0.029 in mean cosine similarity, which is nothing; a hand-built activity
       profile --- level, spread, burstiness and the envelope's own spectrum per block ---
       separated them by **-0.007, the wrong way**.

       The reason is visible once stated: a videogram column encodes *where in the frame*
       the motion was, and over hours that mostly tracks where the dancers are standing.
       It is a position signal, and smoothing and time-delay embedding do not turn a
       position signal into a structure signal.

       So `features="videogram"` is kept for material where the frame does carry
       structure, and it is not the default. Whichever you use, check it against something
       you already know before believing a figure: a self-similarity matrix always produces
       a plausible-looking picture, which is exactly what makes it dangerous.

    Args:
        analysis_dir: Directory holding the cached pyramid.
        duration_s (float): Length of the recording.
        out: Output path.
        hierarchy: A `Hierarchy` whose boundaries are drawn, or None.
        levels (tuple): Which levels to draw. Empty means all.
        max_columns (int): Resolution of the matrix. Defaults to 700.
        which (str): Which pyramid to read. Defaults to ``"videogram_v"``.
        title: Figure title.
        embed (int): Time-delay embedding: how many consecutive columns are stacked into
            each feature vector, so a vector describes a short passage rather than an
            instant. **Defaults depend on the feature, because what rescues one handicaps
            the other.** Videogram columns need it badly --- without it the matrix is one
            broad diagonal with no blocks --- so the default there is 12. MFCCs already
            describe a window's spectral envelope, and stacking dilutes them: on the corpus this was
            written for, embedding and smoothing cut the measured separation from +0.259
            to +0.142. So the audio default is 1, meaning none.
        smooth (int): Columns to average before embedding. 9 for videogram; 3 for audio,
            which is the knee of a two-criterion sweep --- it keeps essentially all of the
            discrimination (+0.257 of a possible +0.259) while raising local coherence from
            0.48 to 0.76, which is the difference between a readable figure and a mess of
            stripes.
        features (str): ``"audio"`` for MFCCs, which is the default and the one that was
            measured to work, or ``"videogram"`` for the cached pyramid.
        audio: Path to a WAV for ``features="audio"``. Defaults to `audio16k.wav` beside
            the analysis directory.
        n_mfcc (int): How many MFCCs. Defaults to 20.

    Returns:
        Path: The image written.
    """
    import matplotlib
    matplotlib.use("Agg", force=False)
    import matplotlib.pyplot as plt
    from pathlib import Path

    if features not in ("audio", "videogram"):
        raise ValueError(f'features must be "audio" or "videogram", not {features!r}')
    #: Chosen on two criteria, not one. Separation against the known answer is the first,
    #: but a matrix whose neighbouring cells are uncorrelated is a mess of stripes whatever
    #: it separates, and this figure exists to be looked at. Measuring both across a small
    #: grid put the knee at 3: separation +0.257 against a maximum of +0.259, and local
    #: coherence up from 0.48 to 0.76. Smoothing further buys readability at real cost ---
    #: 9 keeps only +0.153.
    if smooth is None:
        smooth = 3 if features == "audio" else 9
    if embed is None:
        embed = 1 if features == "audio" else 12

    if features == "audio":
        import librosa
        wav = Path(audio) if audio else Path(analysis_dir) / "audio16k.wav"
        if not wav.exists():
            raise FileNotFoundError(
                f"{wav} not found. structure_map defaults to audio features because they "
                f"are the ones measured to work; pass features='videogram' deliberately "
                f"if you mean to use the video ones.")
        y, sr = librosa.load(str(wav), sr=16000, mono=True)
        F = librosa.feature.mfcc(y=y, sr=sr, n_mfcc=n_mfcc)
        e = np.linspace(0, F.shape[1], max_columns + 1).astype(int)
        X = np.array([F[:, e[i]:max(e[i] + 1, e[i + 1])].mean(axis=1)
                      for i in range(max_columns)])
        #: Centre each dimension: MFCC 0 is overall energy and would otherwise dominate every
        #: similarity, making the figure a picture of how loud the room was.
        X = X - X.mean(axis=0)
    else:
        from musicalgestures._tracks import read_columns

        cols, _ = read_columns(analysis_dir, 0.0, duration_s, max_columns=max_columns,
                               which=which)
        X = np.asarray(cols, dtype=float)
        if X.ndim == 1:
            X = X[None, :]
        if X.shape[0] < X.shape[1]:
            X = X.T                              # rows are time
    #: Cosine similarity on unit-normalised rows. A zero row would divide by zero and is
    #: a real state --- a still moment --- so it is given a norm of one and comes out
    #: dissimilar to everything, which is the honest answer for "nothing happened here".
    #: Smooth, then stack. Both matter and the order does: smoothing after embedding would
    #: blur across passage boundaries that the embedding exists to expose.
    if smooth > 1 and X.shape[0] > smooth:
        k = np.ones(smooth) / smooth
        X = np.apply_along_axis(lambda v: np.convolve(v, k, mode="same"), 0, X)
    if embed > 1 and X.shape[0] > embed:
        X = np.concatenate([X[i:X.shape[0] - embed + 1 + i] for i in range(embed)], axis=1)

    norms = np.linalg.norm(X, axis=1, keepdims=True)
    norms[norms == 0] = 1.0
    S = (X / norms) @ (X / norms).T

    n = S.shape[0]
    #: COLOUR SCALE FROM THE DATA, not from the range of a cosine. Centring the features
    #: puts half the matrix below zero --- "less alike than average" --- and a full -1..1
    #: scale spends half the colormap on that, which is where the checkerboard glare comes
    #: from. What a reader wants is where things are MORE alike than usual, so the scale
    #: starts at the median and ends at the 98th percentile.
    lo_v = float(np.percentile(S, 50))
    hi_v = float(np.percentile(S, 98))
    fig, ax = plt.subplots(figsize=(8.5, 8.5))
    ax.imshow(S, cmap="magma", origin="lower", vmin=lo_v, vmax=hi_v,
              extent=(0, duration_s, 0, duration_s))
    names = list(levels) if levels else (list(hierarchy.levels) if hierarchy else [])
    for name in names:
        for a in hierarchy.levels.get(name, []):
            for t in (a.start, a.end):
                if 0 <= t <= duration_s:
                    ax.axvline(t, color="#66ccff", linewidth=0.6, alpha=0.7)
                    ax.axhline(t, color="#66ccff", linewidth=0.6, alpha=0.7)
    ax.set_xlabel("time (s)")
    ax.set_ylabel("time (s)")
    fig.suptitle(title or f"self-similarity, "
                          f"{'MFCC' if features == 'audio' else which}", fontsize=10)
    fig.text(0.995, 0.005, f"{n} columns, {duration_s / max(1, n):.1f} s each; "
                           f"{features} features, smoothed over {smooth}, "
                           f"embedded over {embed}; "
                           f"boundaries drawn from {', '.join(names) or 'nothing'}",
             ha="right", va="bottom", fontsize=7, color="#555555")
    out = Path(out)
    fig.savefig(out, bbox_inches="tight", dpi=130)
    plt.close(fig)
    _sidecar(out, {"image": out.name, "duration_s": duration_s, "n_columns": n,
                   "colour_vmin": round(lo_v, 4), "colour_vmax": round(hi_v, 4),
                   "colour_note": "median to 98th percentile of this matrix, not -1 to 1",
                   "seconds_per_column": duration_s / max(1, n), "features": features,
                   "which": which if features == "videogram" else None,
                   "smooth": smooth, "embed": embed, "levels": names})
    return out