Skip to content

Timeline

Sheets: videogram, motion, sound and segmentation on a shared time axis.
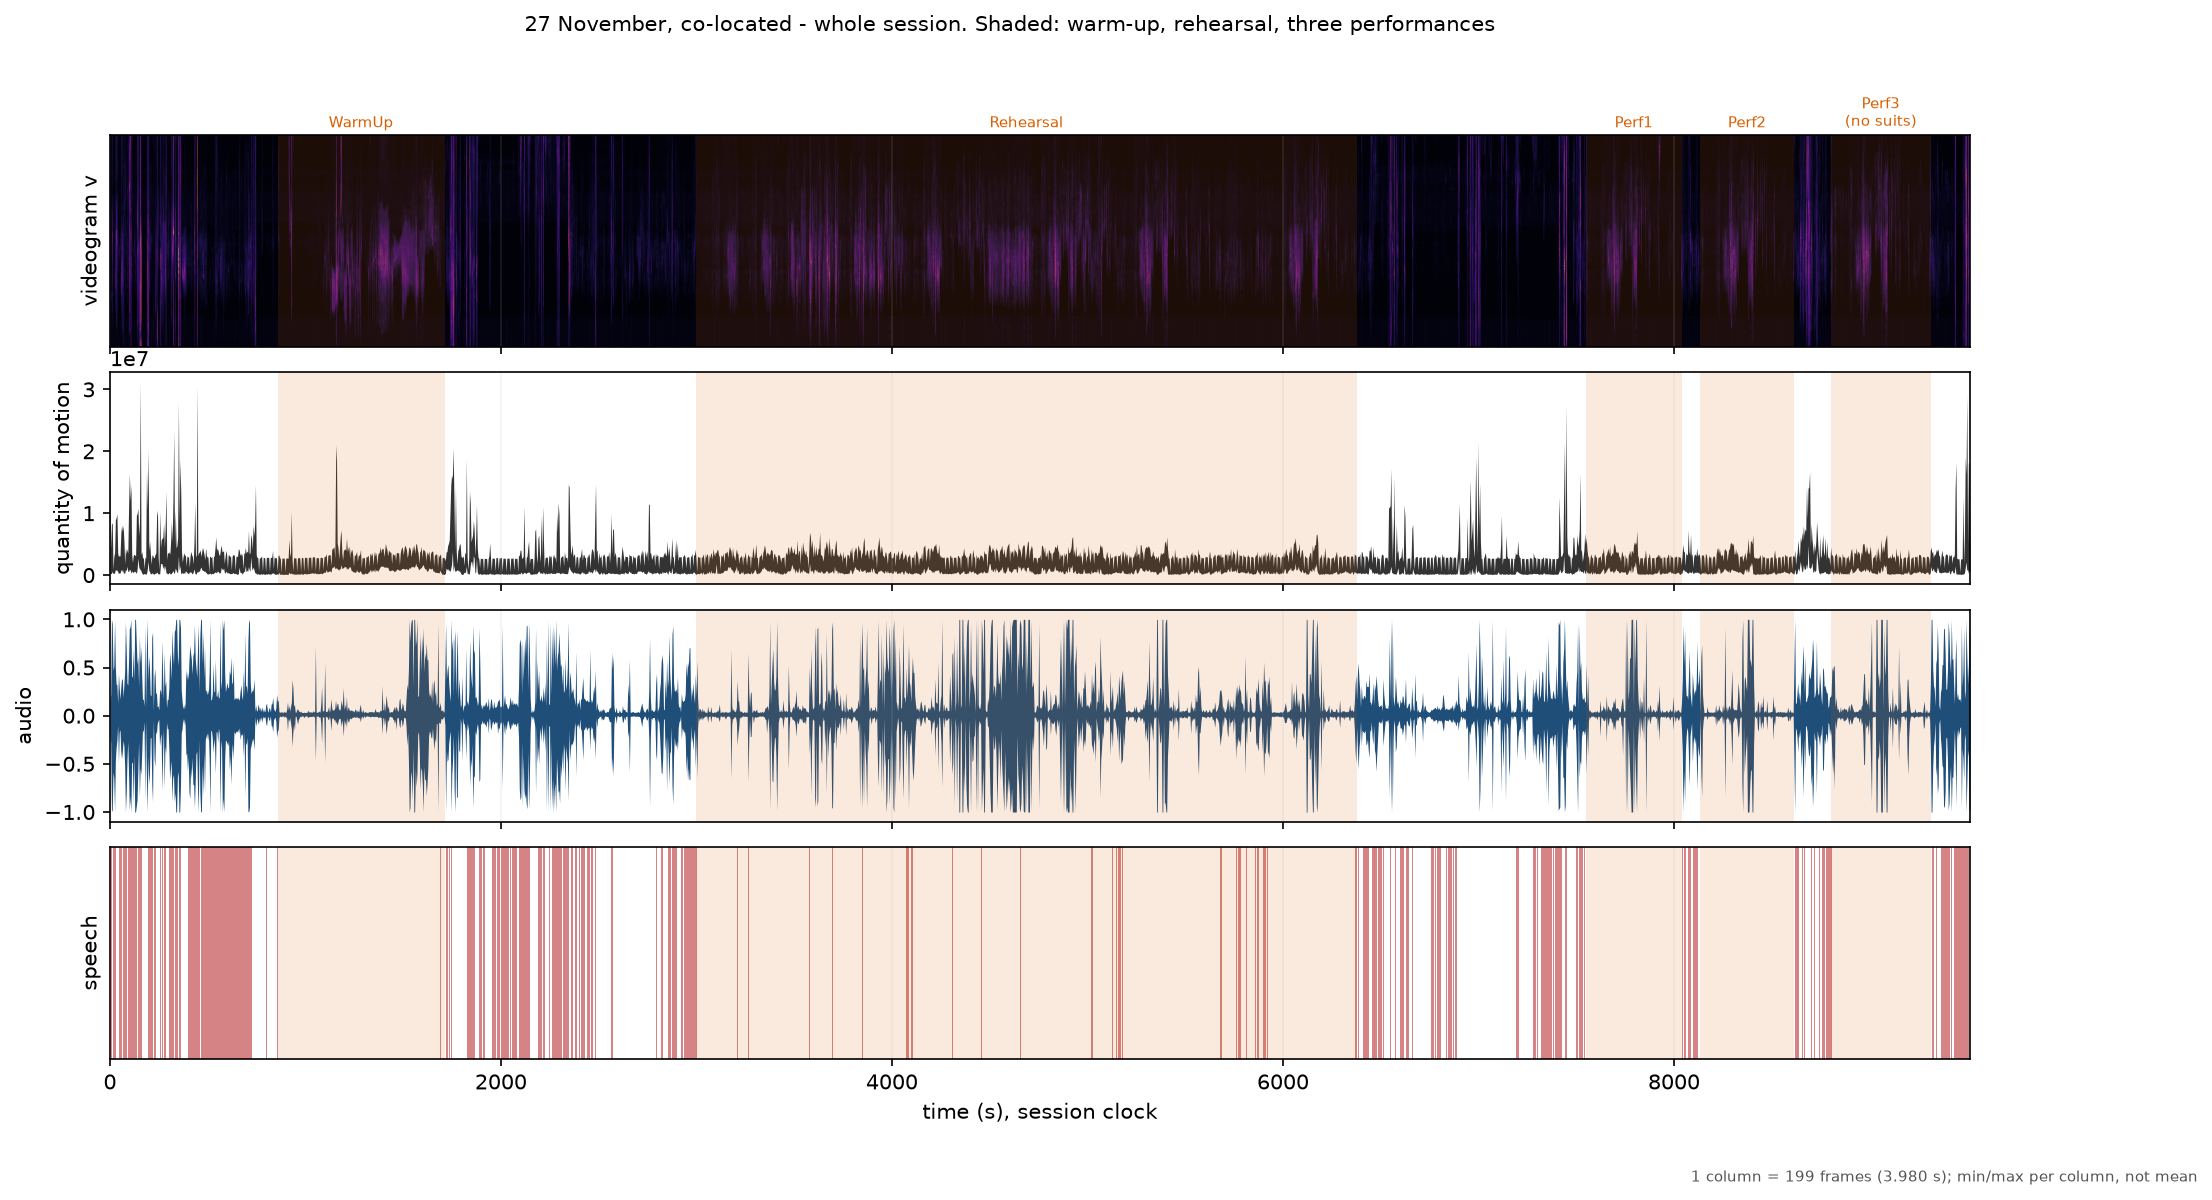
A session sheet with sections shaded

shade= draws a span's extent rather than the line where it began. A line lets a reader assume a section ran until the next line; on the corpus this was built for that is wrong by 21 minutes, because the warm-up ends and nothing happens for a third of an hour before the rehearsal starts.

Every sheet prints its own decimation factor, so a rendering artefact is never mistaken for data, and writes a JSON sidecar recording every boundary drawn.

The composite sheet: videogram, envelope, waveform and segmentation on one axis.

One renderer, three configurations. The overview, the improvisation sheet and the action strip differ only in the span of time they cover and in which level's boundaries they draw, so they are one function called three ways rather than three functions that drift apart.

Boundaries are drawn across every panel, so a proposed cut is read against the motion, the sound and the picture at once rather than against whichever signal produced it.

Video and audio decimate independently. The design's rule is that audio stays on its own clock and is never binned to the 20 ms video frame grid, because forcing both onto one grid quantises away the very asymmetry this corpus was recorded to study. That rule holds at render time too: each panel reduces its own samples to the available pixel columns.

decimate_minmax

decimate_minmax(x, n_columns)

Reduce a signal to n_columns, keeping the extreme of each column.

Never a mean. An overview exists to show where the brief events are, and a mean is precisely what removes them: a single frame of large motion in a four-second column is the thing a viewer zoomed out to find.

The final partial column is kept rather than truncated away, so the end of a recording is drawn, and it is padded with the edge value rather than with zeros, which would draw a trough that is not in the recording.

Parameters:

Name Type Description Default
x

The signal, one dimension.

required
n_columns int

How many output columns are wanted.

required

Returns:

Name Type Description
tuple

(mins, maxs, factor), where factor is samples per column and is

meant to be printed on the figure.

Source code in musicalgestures/_timeline.py
28
29
30
31
32
33
34
35
36
37
38
39
40
41
42
43
44
45
46
47
48
49
50
51
52
53
54
55
56
57
58
59
60
61
62
63
64
65
66
def decimate_minmax(x, n_columns: int):
    """Reduce a signal to `n_columns`, keeping the extreme of each column.

    **Never a mean.** An overview exists to show where the brief events are, and a
    mean is precisely what removes them: a single frame of large motion in a
    four-second column is the thing a viewer zoomed out to find.

    The final partial column is kept rather than truncated away, so the end of a
    recording is drawn, and it is padded with the edge value rather than with zeros,
    which would draw a trough that is not in the recording.

    Args:
        x: The signal, one dimension.
        n_columns (int): How many output columns are wanted.

    Returns:
        tuple: (mins, maxs, factor), where `factor` is samples per column and is
        meant to be printed on the figure.
    """
    if n_columns < 1:
        #: A caller computing columns from a figure width can arrive here with zero,
        #: and `n / n_columns` would raise ZeroDivisionError from inside a renderer
        #: rather than at the point the width was decided.
        raise ValueError(f"n_columns must be at least 1, not {n_columns}")
    v = np.asarray(x, float).ravel()
    n = v.size
    if n == 0:
        return np.zeros(0), np.zeros(0), 1
    if n_columns >= n:
        return v.copy(), v.copy(), 1

    factor = int(np.ceil(n / n_columns))
    pad = (-n) % factor
    if pad:
        #: Pad with the edge value, not with zeros: zeros would invent a trough at
        #: the end of every recording whose length is not a multiple of the factor.
        v = np.concatenate([v, np.full(pad, v[-1])])
    block = v.reshape(-1, factor)
    return block.min(axis=1), block.max(axis=1), factor

render_timeline

render_timeline(analysis_dir, start_s=0.0, end_s=None, panels=('videogram_v', 'qom', 'waveform', 'speech'), levels=('part',), hierarchy=None, speech=None, audio=None, out=None, dpi=150, title=None, shade=None, shade_label='shade')

One sheet: videogram, motion, sound and segmentation on a shared time axis.

The same function makes all three tiers. An overview passes the whole file and levels=("part",); an improvisation sheet passes one part's span and levels=("phrase",); an action strip passes one phrase and levels=("action",).

A sidecar .json is written beside the image recording the decimation factor, the time range and every boundary drawn, so a figure can always be traced back to the numbers behind it.

Parameters:

Name Type Description Default
analysis_dir

Directory holding tracks.json and the memmaps.

required
start_s float

Where the sheet begins, in seconds.

0.0
end_s

Where it ends. None means the end of the recording.

None
panels tuple

Which panels to stack, top to bottom. A waveform panel is skipped when no audio is given rather than drawn empty.

('videogram_v', 'qom', 'waveform', 'speech')
levels tuple

Which hierarchy levels to draw boundaries for.

('part',)
hierarchy

A Hierarchy, or None to draw no boundaries.

None
speech

Speech spans for the speech panel, or None.

None
audio

Path to a WAV for the waveform panel, or None to skip it.

None
out

Output path. Defaults to a name built from the time range.

None
dpi int

Figure resolution. Defaults to 150.

150
title

Figure title. Defaults to the directory name and time range.

None
shade

Actions to draw as shaded regions rather than as boundary lines. A line marks where something began and lets a reader assume it ran until the next line; on this project's corpus that is wrong by 21 minutes, because the warm-up ends and nothing happens for a third of an hour before the rehearsal starts. Where a span has an extent, showing the extent is the honest figure. Defaults to None. The idiom is annat_shade() from Finn Upham's Laughter_Dance.

None
shade_label str

Which label key to read from each shaded Action for its caption. Defaults to "shade".

'shade'

Returns:

Name Type Description
Path

The image written.

Source code in musicalgestures/_timeline.py
 76
 77
 78
 79
 80
 81
 82
 83
 84
 85
 86
 87
 88
 89
 90
 91
 92
 93
 94
 95
 96
 97
 98
 99
100
101
102
103
104
105
106
107
108
109
110
111
112
113
114
115
116
117
118
119
120
121
122
123
124
125
126
127
128
129
130
131
132
133
134
135
136
137
138
139
140
141
142
143
144
145
146
147
148
149
150
151
152
153
154
155
156
157
158
159
160
161
162
163
164
165
166
167
168
169
170
171
172
173
174
175
176
177
178
179
180
181
182
183
184
185
186
187
188
189
190
191
192
193
194
195
196
197
198
199
200
201
202
203
204
205
206
207
208
209
210
211
212
213
214
215
216
217
218
219
220
221
222
223
224
225
226
227
228
229
230
231
232
233
234
235
236
237
238
239
240
241
242
243
244
245
246
247
248
249
250
251
252
253
254
255
def render_timeline(analysis_dir, start_s: float = 0.0, end_s=None,
                    panels=("videogram_v", "qom", "waveform", "speech"),
                    levels=("part",), hierarchy=None, speech=None, audio=None,
                    out=None, dpi: int = 150, title=None, shade=None,
                    shade_label: str = "shade"):
    """One sheet: videogram, motion, sound and segmentation on a shared time axis.

    The same function makes all three tiers. An overview passes the whole file and
    `levels=("part",)`; an improvisation sheet passes one part's span and
    `levels=("phrase",)`; an action strip passes one phrase and `levels=("action",)`.

    A sidecar `.json` is written beside the image recording the decimation factor, the
    time range and every boundary drawn, so a figure can always be traced back to the
    numbers behind it.

    Args:
        analysis_dir: Directory holding `tracks.json` and the memmaps.
        start_s (float): Where the sheet begins, in seconds.
        end_s: Where it ends. None means the end of the recording.
        panels (tuple): Which panels to stack, top to bottom. A `waveform` panel is
            skipped when no `audio` is given rather than drawn empty.
        levels (tuple): Which hierarchy levels to draw boundaries for.
        hierarchy: A `Hierarchy`, or None to draw no boundaries.
        speech: Speech spans for the `speech` panel, or None.
        audio: Path to a WAV for the `waveform` panel, or None to skip it.
        out: Output path. Defaults to a name built from the time range.
        dpi (int): Figure resolution. Defaults to 150.
        title: Figure title. Defaults to the directory name and time range.
        shade: Actions to draw as shaded regions rather than as boundary lines. A line
            marks where something began and lets a reader assume it ran until the next
            line; on this project's corpus that is wrong by 21 minutes, because the
            warm-up ends and nothing happens for a third of an hour before the rehearsal
            starts. Where a span has an extent, showing the extent is the honest figure.
            Defaults to None. The idiom is `annat_shade()` from Finn Upham's
            `Laughter_Dance`.
        shade_label (str): Which label key to read from each shaded Action for its
            caption. Defaults to ``"shade"``.

    Returns:
        Path: The image written.
    """
    import matplotlib
    matplotlib.use("Agg", force=False)
    import matplotlib.pyplot as plt
    from matplotlib.patches import Rectangle

    d = Path(analysis_dir)
    meta = json.loads((d / "tracks.json").read_text())
    fps = float(meta["fps"])
    n_frames = int(meta["frames"])
    end_s = float(meta["duration_s"]) if end_s is None else float(end_s)
    start_s = max(0.0, float(start_s))

    #: The number of columns the sheet can actually show. Everything decimates to
    #: this, and nothing is drawn at a resolution the page cannot carry.
    fig_w_in = 16.0
    n_columns = int(fig_w_in * dpi)

    drawn = [p for p in panels if p != "waveform" or audio is not None]
    fig, axes = plt.subplots(len(drawn), 1, figsize=(fig_w_in, 2.0 * len(drawn)),
                             sharex=True, dpi=dpi,
                             gridspec_kw={"hspace": 0.12})
    if len(drawn) == 1:
        axes = [axes]

    factor = 1
    qom_style, qom_points = None, 0
    i0 = int(start_s * fps)
    i1 = max(min(int(end_s * fps), n_frames), i0 + 1)

    for ax, panel in zip(axes, drawn):
        if panel in ("videogram_v", "videogram_h", "motiongram_v", "motiongram_h"):
            from musicalgestures._tracks import read_columns
            cols, spc = read_columns(d, start_s, end_s, max_columns=n_columns,
                                     which=panel)
            if cols.size:
                ax.imshow(cols.T, aspect="auto", origin="lower", cmap="magma",
                          extent=(start_s, end_s, 0, cols.shape[1]))
                factor = max(factor, int(round(spc * fps)))
            ax.set_ylabel(panel.replace("_", " "))
            ax.set_yticks([])

        elif panel == "qom":
            q = np.memmap(d / meta["qom"], dtype=np.float32, mode="r",
                          shape=(n_frames,))[i0:i1]
            mins, maxs, f = decimate_minmax(np.asarray(q, dtype=float), n_columns)
            factor = max(factor, f)
            t = np.linspace(start_s, end_s, len(maxs))
            if f == 1:
                #: UNDECIMATED, SO DRAW A LINE. With one sample per column the min and
                #: the max of that column are the same number, and `fill_between`
                #: between two identical curves fills a region of zero height --- an
                #: empty panel with correctly labelled axes, which looks like missing
                #: data rather than like a bug. Found on the first action-level sheet
                #: rendered from the real session; the overview never showed it,
                #: because an overview always decimates.
                ax.plot(t, maxs, linewidth=0.7, color="#333333")
                qom_style = "line"
            else:
                #: Fill between the extremes rather than plotting a line through a
                #: mean: the band IS the information at this magnification.
                ax.fill_between(t, mins, maxs, linewidth=0, color="#333333")
                qom_style = "band"
            qom_points = int(len(maxs))
            ax.set_ylabel("quantity of motion")

        elif panel == "waveform":
            import librosa
            wav, sr = librosa.load(str(audio), sr=None, mono=True,
                                   offset=start_s, duration=max(end_s - start_s, 0.01))
            #: Audio decimates on its OWN clock, to the same pixel columns. It is not
            #: binned to the 20 ms video grid, here or anywhere.
            mins, maxs, _ = decimate_minmax(wav, n_columns)
            t = np.linspace(start_s, end_s, len(maxs))
            ax.fill_between(t, mins, maxs, linewidth=0, color="#1f4e79")
            ax.set_ylabel("audio")

        elif panel == "speech":
            for s in speech or []:
                if s.end > start_s and s.start < end_s:
                    ax.add_patch(Rectangle((s.start, 0.0), s.end - s.start, 1.0,
                                           color="#c44e52", alpha=0.7, linewidth=0))
            ax.set_ylim(0, 1)
            ax.set_ylabel("speech")
            ax.set_yticks([])

        ax.set_xlim(start_s, end_s)
        ax.grid(axis="x", alpha=0.15)

    shaded = []
    for a in shade or []:
        if a.end <= start_s or a.start >= end_s:
            continue
        for ax in axes:
            ax.axvspan(a.start, a.end, facecolor="#d95f02", alpha=0.13, linewidth=0)
        label = a.labels.get(shade_label, "")
        axes[0].annotate(label, (0.5 * (a.start + a.end), 1.02),
                         xycoords=("data", "axes fraction"), fontsize=7,
                         ha="center", va="bottom", color="#d95f02")
        shaded.append({"start": a.start, "end": a.end, "label": label})

    boundaries = []
    if hierarchy is not None:
        for level in levels:
            for a in hierarchy.levels.get(level, []):
                if a.end <= start_s or a.start >= end_s:
                    continue
                agreement = a.features.get("agreement")
                style = _BOUNDARY_STYLE.get(agreement, "dotted")
                for ax in axes:
                    ax.axvline(a.start, color="#d95f02", linestyle=style,
                               linewidth=1.2, alpha=0.9)
                axes[0].annotate(a.labels.get(level, level),
                                 (a.start, 1.02), xycoords=("data", "axes fraction"),
                                 fontsize=7, rotation=90, va="bottom",
                                 color="#d95f02")
                boundaries.append({"level": level, "start": a.start, "end": a.end,
                                   "agreement": agreement, "linestyle": style,
                                   "label": a.labels.get(level)})

    axes[-1].set_xlabel("time (s), session clock")
    note = (f"1 column = {factor} frames ({factor / fps:.3f} s); "
            f"min/max per column, not mean")
    fig.text(0.995, 0.005, note, ha="right", va="bottom", fontsize=7, color="#555555")
    fig.suptitle(title or f"{d.name}  {start_s:.1f}-{end_s:.1f} s", fontsize=10)

    out = Path(out) if out else d / f"sheet_{int(start_s):06d}_{int(end_s):06d}.png"
    fig.savefig(out, bbox_inches="tight")
    plt.close(fig)

    out.with_suffix(".json").write_text(json.dumps(
        {"image": out.name, "start_s": start_s, "end_s": end_s,
         "decimation_factor": factor, "printed_on_figure": True,
         "seconds_per_column": factor / fps, "panels": list(drawn),
         "levels": list(levels), "boundaries": boundaries, "shaded": shaded,
         "qom_style": qom_style, "qom_points": qom_points,
         "note": ("min/max per column, never a mean: a brief motion is what an "
                  "overview exists to find and a mean is what removes it")},
        indent=1) + "\n")
    return out