This week we turn to vision and its role in how we perceive and make sense of sound and music. It sits at the perception level of the four levels of description, with an awkward consequence: if what you see changes what you hear, then perception is not a clean readout of the physical signal at all, and an analysis based on a recording alone is missing part of its evidence. We use our eyes to get around, but they also shape what we hear. Visual cues colour how we interpret a sound, set up expectations, and help us follow a complex performance. Watch a musician’s sound-producing actions, or a conductor’s gestures, and you can hear rhythm, timing, and emotion differently. We will look at how the brain combines what we see with what we hear, work through auditory–visual illusions, and consider why visual feedback matters when learning and performing music. The examples and experiments along the way show how seeing and hearing work together, on stage and in everyday life.
Auditory–visual interaction
This chapter first clarifies how vision and audition interact, especially in music psychology and technology, before we turn to the anatomy of the eye and the use of eye tracking in performance and perception research.
Auditory/visual vs. audio/video
In this course we distinguish between the terms auditory/visual and audio/video. They refer to different domains:
Audio/Video: These terms relate to the technological capture, processing, and reproduction of sound and moving images. Audio refers to the recording, transmission, and playback of sound signals, whether analogue or digital. Video involves the recording, processing, and display of moving images.
Auditory/Visual: These terms denote the biological sensory modalities and their perceptual processes. The auditory system transduces air-pressure fluctuations (sound) into neural signals that encode pitch, loudness, timbre and spatial position. The visual system transduces visible electromagnetic radiation (light) into neural representations of luminance, colour, form, motion and depth. Perception arises from both the physical properties of stimuli (frequency/wavelength, intensity) and neural processing (adaptation, attention, context), and it underlies how we integrate cues across the senses.
Keeping these apart helps. The physical phenomena are sound and light, we perceive them through the auditory and visual modalities, and we capture them technically as audio and video. The distinction matters for understanding how audio–video systems work and how we perceive our surroundings, and it matters especially in music, where seeing and hearing combine to shape the experience.
Integration of the senses
Auditory–visual integration is the brain’s ability to combine sound and sight to sharpen perception and comprehension; it underpins tasks like speech perception and shapes multimedia experiences.
Two terms are easy to confuse here. Multimodal perception is the ordinary case: several senses contribute to one percept at the same time. When you watch and hear a drummer, you perceive one stroke, not a sight plus a sound, and each sense adds information the other lacks, the eyes giving the preparation and the place of the stroke, the ears its timing and timbre. The senses are combined, and the result is richer than either alone. Crossmodal perception is when one sense changes what another sense reports: what you see alters what you hear, or what you hear alters what you see, although the information reaching the second sense has not changed. The two are not rival theories but two views of the same machinery. Integration is what the brain does all the time; a crossmodal effect is what that integration looks like when the senses disagree and the brain settles the disagreement in favour of one of them. Everyday music listening is multimodal; the illusions below are crossmodal, since in each a change in one sense changes the percept in another.
Crossmodal effects range from the bouba–kiki pairing of sounds with shapes met in tuning in to illusions in which one sense overrides another. One famous auditory–visual illusion is the McGurk effect. Watch this clip from the BBC television series Horizon:
(If the video is unavailable, try the archived page.)
When the visual mouth movements of one speech sound are paired with the acoustic signal of another, observers often perceive a third, fused sound (classically: audio “ba” + visual “ga” → perceived “da”). Vision can change what we hear at a basic perceptual level, not only our later judgements.
Dig deeper: what drives and modulates the McGurk effect
The effect arises because the brain combines temporally coincident but conflicting cues across modalities within a limited temporal window; cortical areas such as the superior temporal sulcus, a region where auditory and visual information meet, are implicated in resolving the mismatch. Several factors modulate it: timing (asynchrony reduces fusion), signal clarity (degraded audio strengthens visual influence), attention, and individual differences (e.g., lip-reading skill).
The same principles explain why, in music, seeing a performer’s gestures, facial movements, or instrument actions can change the perceived onset, articulation, or expressiveness of a sound. The effect has been shown for singing: when the video of a singer performing one interval was paired with the sound of a different one, viewers heard the interval as smaller or larger depending on what the face was doing Laeng et al., 2021.
Vision is not the only partner sense: touch and vibration also carry musical structure, from bass felt in the chest at a concert to vibrotactile interfaces, and those channels are treated in the body.
Ventriloquism, spatial capture, and temporal binding
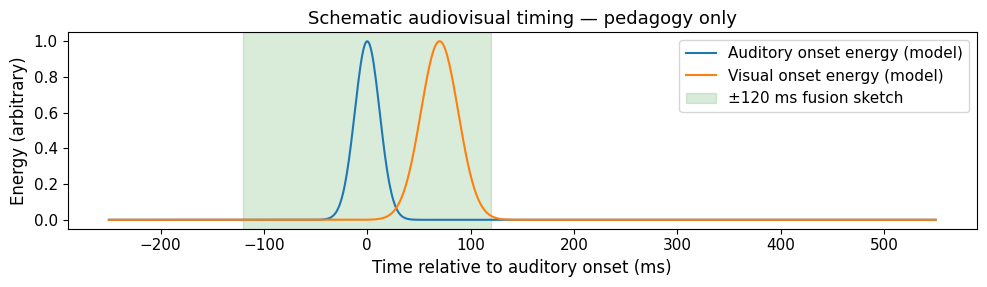
The ventriloquism effect in perception research (broader than stage ventriloquism) is the tendency for vision to bias perceived sound location towards a seen source when auditory and visual information arrive close in time. In concerts, film, games, and VR, the apparent spatial image therefore depends on the loudspeaker or headphone rendering and on what you see, which is one reason staging, lighting, and picture cuts interact with mix choices. The effect is strongest inside a short multisensory binding window (roughly tens to a few hundred milliseconds, depending on task and stimulus quality) and weakens when sight and sound are clearly out of step.
The sketch below shows how such binding is usually pictured: two smooth, bell-shaped pulses of onset energy, one auditory and one visual, and a shaded band marking the rough time window within which the brain tends to bind the two into a single event. The widths are illustrative rather than fitted to individual listeners.
Source
import numpy as np
import matplotlib.pyplot as plt
plt.rcParams.update({
    "font.size": 10,
    "axes.titlesize": 11,
    "axes.labelsize": 10,
    "xtick.labelsize": 9,
    "ytick.labelsize": 9,
    "legend.fontsize": 9,
    "figure.figsize": (10, 4),
    "figure.dpi": 100,
    "savefig.dpi": 150,
    "axes.spines.top": False,
    "axes.spines.right": False,
})

t = np.linspace(-0.25, 0.55, 800)
audio = np.exp(-((t - 0.0) ** 2) / (2 * 0.012**2))
visual = np.exp(-((t - 0.07) ** 2) / (2 * 0.018**2))

fig, ax = plt.subplots(figsize=(10, 3))
ax.plot(t * 1000, audio, label="Auditory onset energy (model)")
ax.plot(t * 1000, visual, label="Visual onset energy (model)")
ax.axvspan(-120, 120, alpha=0.15, color="green", label="±120 ms fusion sketch")
ax.set_xlabel("Time relative to auditory onset (ms)")
ax.set_ylabel("Energy (arbitrary)")
ax.set_title("Schematic audiovisual timing — pedagogy only")
ax.legend(loc="upper right")
plt.tight_layout()
plt.show()
Notation, score reading, and gaze
Many performance traditions ask you to split attention among a score, a conductor, co-performers, and your own instrument. Eye-tracking studies of sight-reading and score following suggest that scan paths linger on structurally salient places, such as downbeats, cue notes, and page turns, with re-fixations near phrase boundaries Madell & Hébert, 2008. When notation and sound diverge, or a page turn interrupts preview, eye position and metrical attention can briefly decouple, linking to the expectancy and subdivision ideas in time and rhythm.
Dig deeper: how firm is the evidence on music reading?
A methodological review of over two decades of music-reading studies shows that tasks, measures, and stimuli vary so much that general conclusions remain tentative Puurtinen, 2018. Studies comparing paper and screen scores suggest differences in scrolling, peripheral preview, and markup, but here too the evidence base is still thin.
Together with McGurk-style fusion (above), these examples show that music perception in the wild is rarely “audio alone,” even when listeners think they are only listening. That is relevant to multimedia work in machine listening and to embodiment in the body.
Judging with the eyes
If vision can change what we hear, it can also change what we think of a performance. The most striking demonstration comes from a series of experiments by Chia-Jung Tsay Tsay, 2013. Participants—musical novices and professional musicians alike—were asked to pick the winner of an international classical music competition from short excerpts of the finalists. Some received sound only, some video only, some both.
The result was the opposite of what almost everyone predicted. Participants given silent video identified the actual winners at rates well above chance. Those given the sound, with or without video, did not. Asked beforehand, more than four out of five participants said that sound was what mattered most to them; their own judgements said otherwise.
This finding has been productive precisely because it is uncomfortable, and it should be read with care rather than repeated as a slogan. Later work has qualified it. The visual advantage appears to depend on the relative quality of the performers being compared, and it has been examined in traditions beyond Western classical music with mixed results. What survives is the core point, which fits everything else in this chapter. The visual channel is not decoration layered on top of an essentially auditory art. It carries information about effort, confidence, expressive intent, and stagecraft, and listeners use it whether or not they believe they do.
For musicology this cuts in several directions. It bears on how competitions and auditions are run. Screened auditions were introduced in orchestras to remove exactly this kind of bias. It bears on how we should treat historical accounts of performances that no longer exist except as recordings. And it bears on our own analytic habits. An analysis based on a recording is an analysis of a deliberately reduced version of the event.
The original paper is Tsay (2013); it is short, readable, and a good candidate for the claim–evidence–method exercise in the brain.
The concert as a visual event
Staging decisions are perceptual decisions. Where performers stand relative to each other and to the audience sets both what you can see and what you can hear; a soloist stepping forward is a change in visual salience and in direct-to-reverberant ratio at once. Lighting directs attention as reliably as dynamics do. A spotlight is an instruction about where to look, and therefore about which stream to follow.
Screens have made this explicit. Large venues relay close-ups of performers’ hands and faces, so most of an audience now watches a mediated image while hearing an acoustic (or amplified) sound, with the two arriving from different directions. Livestreamed and recorded concerts go further, since a director’s cuts decide what the viewer attends to, moment by moment, a kind of editorial listening guide that the concert hall never imposed.
The same logic shapes music in film, television, and games, where sound and image are constructed together. Michel Chion’s synchresis, met in listening, is the working principle Chion, 2019. Pair a sound with a visible event and the two weld together, whatever the sound’s real source. Foley artists, game audio designers, and composers all rely on it.
The eye
This section gives a practical overview of the eye and why it matters for studies of sound, music, and performance.
Basic anatomy and optics
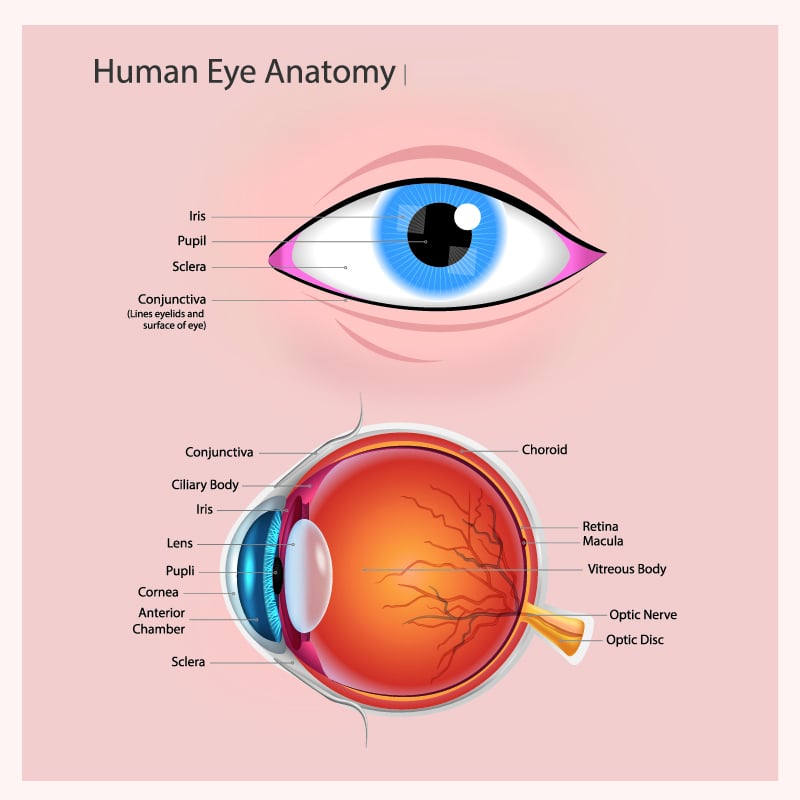
The human eye is an optical organ that focuses light onto the retina, its photosensitive inner surface, so that we see with great clarity. The eye adapts to changing light: in bright surroundings the pupil constricts to sharpen the image and reduce optical distortions; in dim light it dilates to maximise the number of photons reaching the retinal photoreceptors.
Humans have acute vision, exceeded only by birds of prey. Over the course of evolution the human cornea (the transparent front surface of the eye) became the main structure for image formation, while the lens, just behind the pupil, fine-tunes the focus so that images fall sharply on the retina.
The iris, a ring of pigmented muscle tissue, controls the size of the pupil. Its main job is not simply to regulate brightness but to keep visual resolution high under varying light. The pupil’s diameter ranges from about 2 to 8 mm, yet natural light levels can vary by a factor of a million (for example, from moonlight to sunlight).
The retina
The retina turns light into neural signals and does some early processing, such as enhancing contrast, finding edges, and detecting motion. It has three main light sensors: rods (very sensitive, working in dim light and seeing in shades of grey), cones (working in bright light, providing colour vision and packed into the fovea), and ipRGCs (intrinsically photosensitive retinal ganglion cells that help control pupil size and body rhythms).
Eye movements and attention
The eyes move in a few basic ways. Saccades are very fast jumps that land the sharp centre of vision (the fovea) on a new spot, with fixations lasting around 200–400 ms. Smooth pursuit lets the eyes follow a moving object when you can see it. Vergence changes the angle between the two eyes so you can focus on near versus far things. In music settings, where someone looks—at a face, the hands, or the score—strongly shapes the visual information they pick up, and that input can change how they hear, understand, or perform the music.
Pupil control
Pupil size is set by the iris muscles under control of the autonomic nervous system, and it trades off how much light enters the eye against image sharpness. A small pupil gives more depth of field and a sharper image, a large pupil lets in more light. Pupil changes also reflect non-visual states such as mental effort, surprise, or emotional arousal—linked to brain arousal systems such as the locus coeruleus and noradrenaline—and these changes can be measured with pupillometry. When interpreting pupil measurements, keep in mind that lighting, task difficulty, and emotional context all affect pupil size.
Eye tracking and pupillometry
The eye movements and pupil responses described above can be measured. Two methods do most of the work in music research: eye tracking, which records where the eyes point, and pupillometry, which records how wide the pupils are. Both are cameras pointed at the eyes, and both turn vision into data in the same way that motion capture turns movement into data in the body.
Eye tracking
Eye tracking measures where and how the eyes move, which tells us about visual attention, perception, and the cognitive processes behind them. It is used in psychology, neuroscience, marketing, usability studies, and human-computer interaction.
There are two main types of eye tracker: mobile and stationary. Mobile eye trackers are wearable devices, such as glasses, that record eye movements in natural, real-world settings. They suit studies that involve movement, such as sports, navigation, or field research.
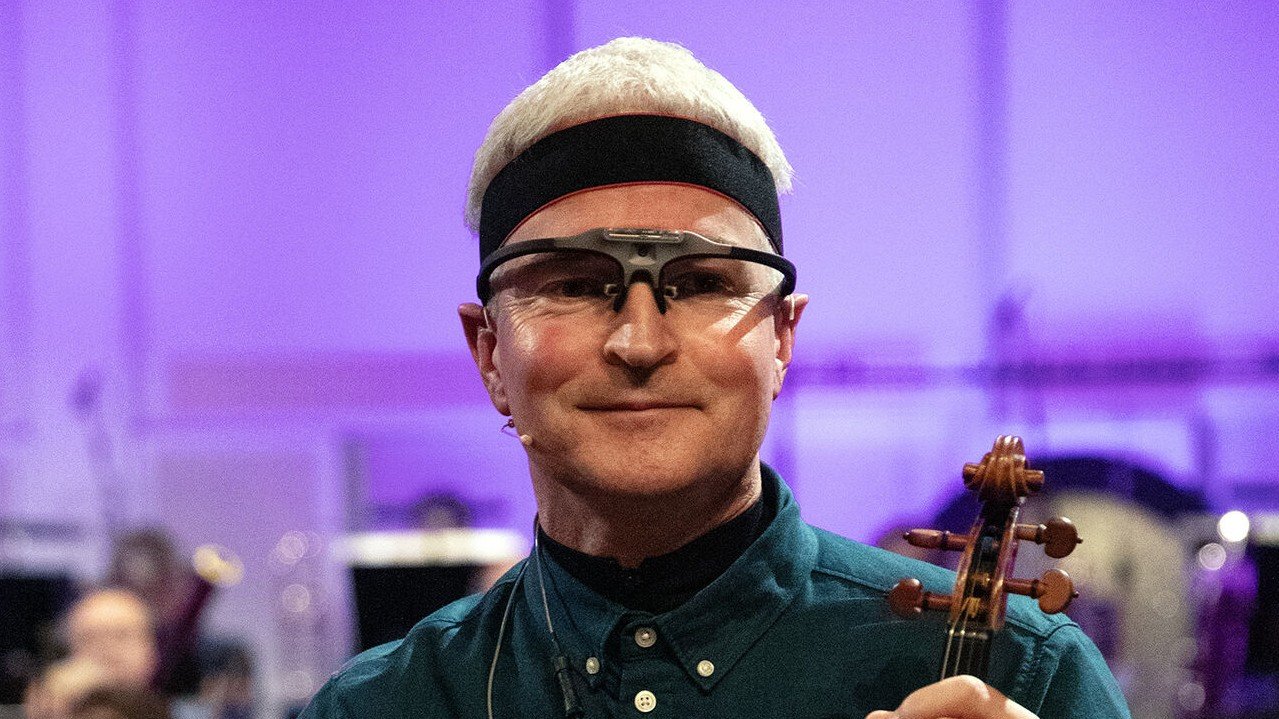
Figure 1: Mobile eye-tracking glasses in use during MusicLab Abels KORK. Image credit: Simen Kjellin/UiO.
Stationary eye trackers are fixed devices, often mounted on a desk or built into a monitor, used in controlled laboratory settings. They suit experiments on reading, visual search, or website usability.
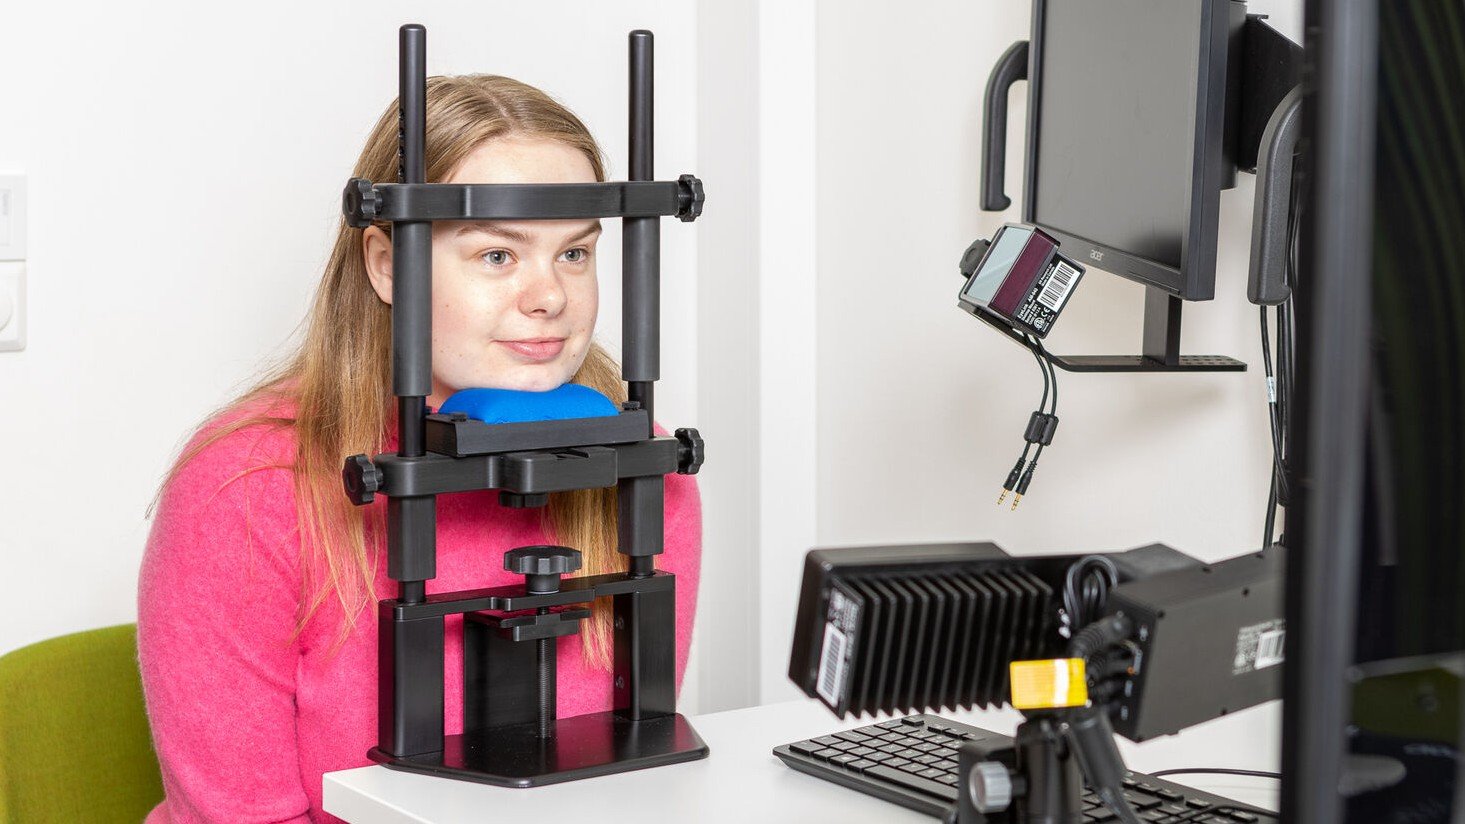
Figure 2: Example of stationary eye-tracking software.
Eye-tracking data reveal patterns of gaze, fixations, and saccades, which help researchers see how people process visual information and where they direct their attention.
Gaze tracking
Gaze is the direction of a person’s visual attention, and it is our main observable proxy for where cognitive resources go. In music research, gaze reveals what performers and listeners attend to (hands, face, score, conductor), how they sample information over time, and how visual cues shape what they hear.
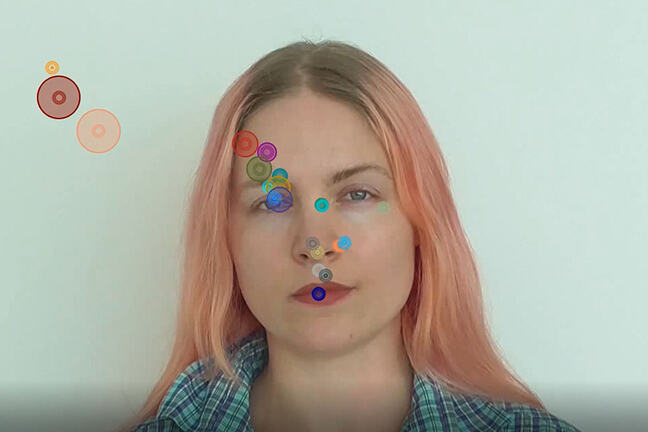
Eye fixations of different individuals (colour circles) and for different durations (size of each circle). Image credit: Bruno Laeng/UiO.
Key gaze events and properties:
- Fixations: brief periods (typically ~200–400 ms, varying by task) when the fovea is held on a location and detailed processing occurs. Fixation count and duration are common measures of interest or difficulty.
- Saccades: rapid relocations of gaze (tens of ms) that reorient foveal vision; saccade amplitude and direction reveal scanning strategies but carry little perceptual detail.
- Smooth pursuit: continuous tracking of a moving target; occurs only when a visible moving stimulus is followed.
- Scanpaths and transitions: sequences of fixations and saccades that describe viewing strategies.
Gaze is a useful proxy for attention, but not a perfect one, since people can attend covertly without moving their eyes. Calibration, sampling rate, and tracker type (mobile vs stationary) set the accuracy and decide which metrics are reliable; for precise saccade dynamics you want a high sampling rate (e.g., >250 Hz). Define areas of interest (AOIs) carefully, using dynamic AOIs for moving performers, and account for head motion in mobile settings. Always read gaze patterns against the task demands, the participant’s expertise, and the stimulus timing, for example the anticipatory fixations seen in sight-reading.
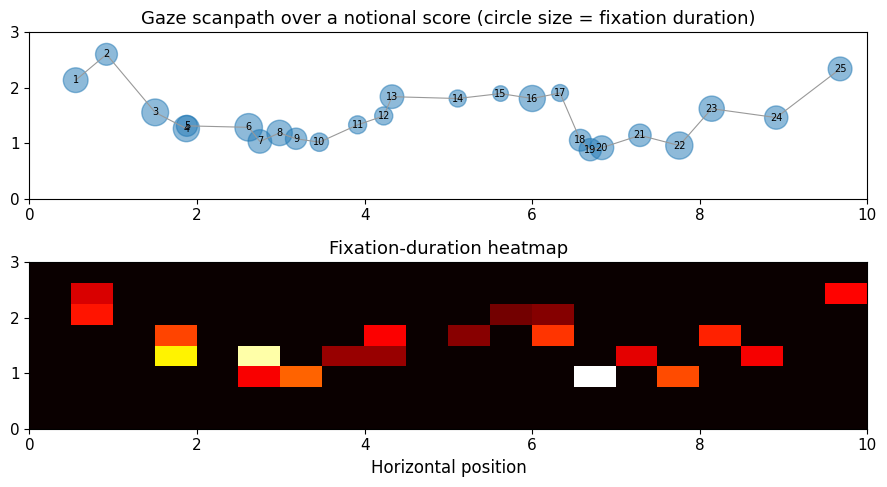
Eye-tracking output is a sequence of fixations (where the eyes paused, and for how long) joined by saccades. Below we simulate fixations sweeping across a notional score and show the two standard views: a scanpath (order and dwell time) and a heatmap (where attention accumulated).
Source
import numpy as np
import matplotlib.pyplot as plt
plt.rcParams.update({
    "font.size": 10,
    "axes.titlesize": 11,
    "axes.labelsize": 10,
    "xtick.labelsize": 9,
    "ytick.labelsize": 9,
    "legend.fontsize": 9,
    "figure.figsize": (10, 4),
    "figure.dpi": 100,
    "savefig.dpi": 150,
    "axes.spines.top": False,
    "axes.spines.right": False,
})

rng = np.random.default_rng(2)
n = 25
xs = np.sort(rng.uniform(0, 10, n))                       # left-to-right reading
ys = 1.5 + 0.6 * np.sin(xs * 1.5) + 0.25 * rng.standard_normal(n)
dur = rng.uniform(0.15, 0.5, n)                           # fixation durations (s)

fig, ax = plt.subplots(2, 1, figsize=(10, 5))
ax[0].plot(xs, ys, "-", color="0.6", lw=0.8)
ax[0].scatter(xs, ys, s=dur * 800, alpha=0.5)
for i, (x, y) in enumerate(zip(xs, ys)):
    ax[0].text(x, y, str(i + 1), ha="center", va="center")
ax[0].set_title("Gaze scanpath over a notional score (circle size = fixation duration)")
ax[0].set_xlim(0, 10); ax[0].set_ylim(0, 3)

H, _, _ = np.histogram2d(xs, ys, bins=[20, 8], range=[[0, 10], [0, 3]], weights=dur)
ax[1].imshow(H.T, origin="lower", aspect="auto", extent=[0, 10, 0, 3], cmap="hot")
ax[1].set_title("Fixation-duration heatmap")
ax[1].set_xlabel("Horizontal position")
plt.tight_layout()
plt.show()
The Eye tracker app shows the principle with a laptop webcam. It finds the dark pupil in the camera image, calibrates with nine points on the screen, and then draws where you look on a page of notation, a text, or a grid of shapes, as a live scanpath and a heatmap, while plotting the area of each pupil over time. It has none of the infrared illumination and corneal reflection that a research tracker uses to cope with head movement, so it is a demonstration of how the method works rather than an instrument, and keeping the head still is part of the exercise.
Pupillometry
Pupillometry is the measurement of pupil size and how it changes over time. Because the pupil responds not only to light but also to cognitive and emotional states, pupillometry lets us study mental effort, arousal, and attention.
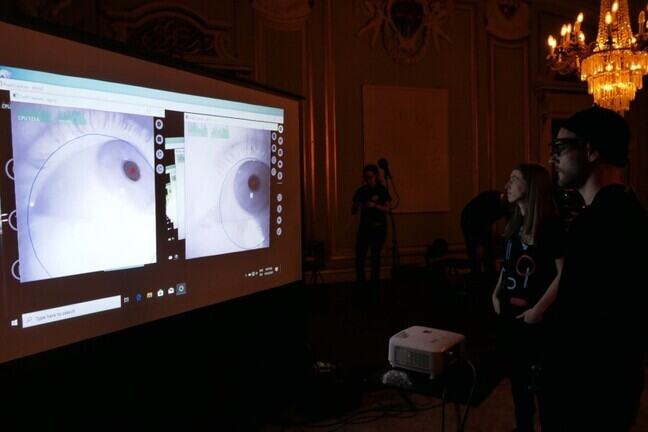
Checking the pupil size before MusicLab Abels KORK.
Daniel Kahneman, Nobel laureate (2002) and author of Thinking, Fast and Slow (2011), once remarked:
“The pupils reflect the extent of mental effort in an incredibly precise way [...] I have never done any work in which the measurement is so precise.”
Decades of research show that pupil diameter reliably tracks mental workload. In a classic study, Hess & Polt (1964) reported steady pupil dilation as participants solved progressively harder arithmetic problems; hundreds of later studies have replicated and extended this, showing that larger or phasic pupil responses often accompany greater cognitive and attentional demands.
Eye tracking and pupillometry in music research
As hardware and software have become more accessible, eye tracking has found wider use in music research. Some typical use-cases:
- Concert performance analysis: Eye tracking shows how audience members watch performers, revealing which gestures or movements draw the most attention and how visual cues shape the perceived expressiveness of the music.
- Music reading and learning: Researchers use eye tracking to analyse how musicians read sheet music, finding patterns in gaze, fixation, and saccades that relate to expertise and sight-reading ability.
- Auditory–visual illusions: Experiments combine sound and video (e.g., the McGurk effect) to show how conflicting visual and auditory cues can alter perception, demonstrating the integration of the senses.
- Emotional response measurement: Pupillometry tracks changes in pupil size as listeners hear emotionally charged music, giving a window onto arousal and engagement.
- Performance anxiety studies: Eye tracking and pupillometry together show how musicians’ gaze patterns and pupil responses change under stress, helping us understand cognitive load and attentional focus during live performance.
- Interactive installations: In music technology and art, eye tracking can control sound parameters or trigger musical events based on where a participant looks, creating immersive auditory–visual experiences.
Across these cases, eye tracking and pupillometry let researchers, teachers, and performers see how vision and audition work together.
Gaze in performance: conductors and ensembles
Eye tracking is not only a laboratory tool; it also reveals how musicians coordinate with one another. Performers use gaze to cue entrances, mark phrase boundaries, and stay together. Ensemble players tend to glance up at structural boundaries and risky transitions, and a conductor’s gaze helps distribute attention across the players and signal who comes next. Gaze is part of the visual channel that runs alongside sound in joint music-making, picked up from a movement angle in the chapter on the body.
At RITMO, the Bodies in Concert project studies exactly this. It combines gaze tracking and pupillometry with motion capture and physiology to follow how the bodies of performers and audiences act together during real classical concerts, working with orchestras such as the Stavanger Symphony Orchestra and the Norwegian Radio Orchestra. The project has shown that attention, and even cardiac activity, can become coordinated during a performance (see the project’s publications, including work by D’Amario and Jensenius on cardiac coherence between musicians and audiences).
A critical look: do blind people hear better?
It is a common belief, reinforced by fiction and by the fame of blind musicians, that losing sight sharpens the ears. This chapter has argued that hearing and seeing are intertwined, so the claim is a natural test case: what actually happens to hearing when vision is absent?
- The claim is that blindness makes the ears more sensitive, and that blind musicians excel because they hear more than the rest of us.
- The evidence says something more specific. Hearing thresholds, the audiogram from the psychoacoustics chapter, are no better in blind people; the ears are the same. What differs is what the brain does with the signal. People blind from early in life locate sounds in the horizontal plane more accurately than sighted people, particularly when listening with one ear Lessard et al., 1998, and they detect changes in pitch faster and more finely, especially when blindness began early Gougoux et al., 2004. Brain imaging shows why: regions that would have processed vision are recruited for hearing, an example of the crossmodal plasticity discussed in this chapter Voss, 2016.
- The method compares small groups of early-blind, late-blind, and sighted listeners on specific tasks, which is why the findings are task-specific rather than a general verdict on hearing.
- The limits are the interesting part. The same early-blind listeners are worse at judging the elevation of a sound source Zwiers et al., 2001, because the cues for up and down are subtle spectral ones that the auditory system normally calibrates against vision. Without sight to teach it, that part of spatial hearing never fully develops. Enhancement in one task and deficit in another is not “better hearing”; it is hearing that has been reorganised.
The popular claim mistakes skill for sensation. Blind musicians play well for the reason sighted ones do, which is thousands of hours of practice, sometimes with attention that vision would otherwise have claimed. What the research shows is subtler and more relevant to this chapter: the senses calibrate each other, and when one is missing the others are re-tuned rather than simply turned up.
- Laeng, B., Kuyateh, S., & Kelkar, T. (2021). Substituting facial movements in singers changes the sounds of musical intervals. Scientific Reports, 11(1), 22442. 10.1038/s41598-021-01797-z
- Madell, J., & Hébert, S. (2008). Eye Movements and Music Reading: Where Do We Look Next? Music Perception, 26(2), 157–170. 10.1525/mp.2008.26.2.157
- Puurtinen, M. (2018). Eye on Music Reading: A Methodological Review of Studies from 1994 to 2017. Journal of Eye Movement Research, 11(2). 10.16910/jemr.11.2.2
- Tsay, C.-J. (2013). Sight over Sound in the Judgment of Music Performance. Proceedings of the National Academy of Sciences, 110(36), 14580–14585. 10.1073/pnas.1221454110
- Chion, M. (2019). Audio-Vision: Sound on Screen (2nd ed.). Columbia University Press. 10.7312/chio18588
- Hess, E. H., & Polt, J. M. (1964). Pupil Size in Relation to Mental Activity During Simple Problem-Solving. Science, 143(3611), 1190–1192. 10.1126/science.143.3611.1190
- Lessard, N., Paré, M., Lepore, F., & Lassonde, M. (1998). Early-Blind Human Subjects Localize Sound Sources Better than Sighted Subjects. Nature, 395(6699), 278–280. 10.1038/26228
- Gougoux, F., Lepore, F., Lassonde, M., Voss, P., Zatorre, R. J., & Belin, P. (2004). Pitch Discrimination in the Early Blind. Nature, 430(6997), 309. 10.1038/430309a
- Voss, P. (2016). Auditory Spatial Perception without Vision. Frontiers in Psychology, 7, 1960. 10.3389/fpsyg.2016.01960
- Zwiers, M. P., Van Opstal, A. J., & Cruysberg, J. R. M. (2001). A Spatial Hearing Deficit in Early-Blind Humans. Journal of Neuroscience, 21(9), RC142. 10.1523/JNEUROSCI.21-09-j0002.2001