This week follows on from the previous week’s focus on music-related movement and embodiment, treating the body as a site of measurable physiological responses to sound and music: markers such as heart rate and heart-rate variability, skin conductance, respiration, and muscle tension, the autonomic mechanisms behind them, and the methodological problems of measuring these signals in the lab, at concerts, or with wearables. Against the four levels of description, the chapter is unusual: the measurements are as physical as anything in acoustics, but they are measurements of a body rather than of air, and every claim made from them is a claim about interpretation; the distance between a heart-rate trace and a feeling is the recurring problem of the chapter.
Physiological reactions
Physiology is the branch of biology that studies the functions and processes of living organisms and their parts (organs, tissues, cells). It explains how structures work, how they interact, and how systems maintain homeostasis. The term comes from the Greek physis (“nature, growth”) and logos (“study, account”). Thinkers as early as Aristotle described various human body functions, but modern experimental physiology took shape from the 17th century onwards, with figures such as William Harvey (blood circulation) and Claude Bernard (the concept of the “milieu intérieur”, or internal environment).
Autonomic mechanisms: sympathetic vs. parasympathetic
The autonomic nervous system (ANS) sits at the core of human physiology and controls many automatic bodily functions. It has two main branches with broadly opposite roles. The sympathetic nervous system mobilises the body for action: it raises heart rate and blood pressure, increases sweating, and redirects blood to the muscles. The parasympathetic nervous system works through the vagus nerve and promotes rest and recovery, slowing the heart, aiding digestion, and supporting calm, restorative states.
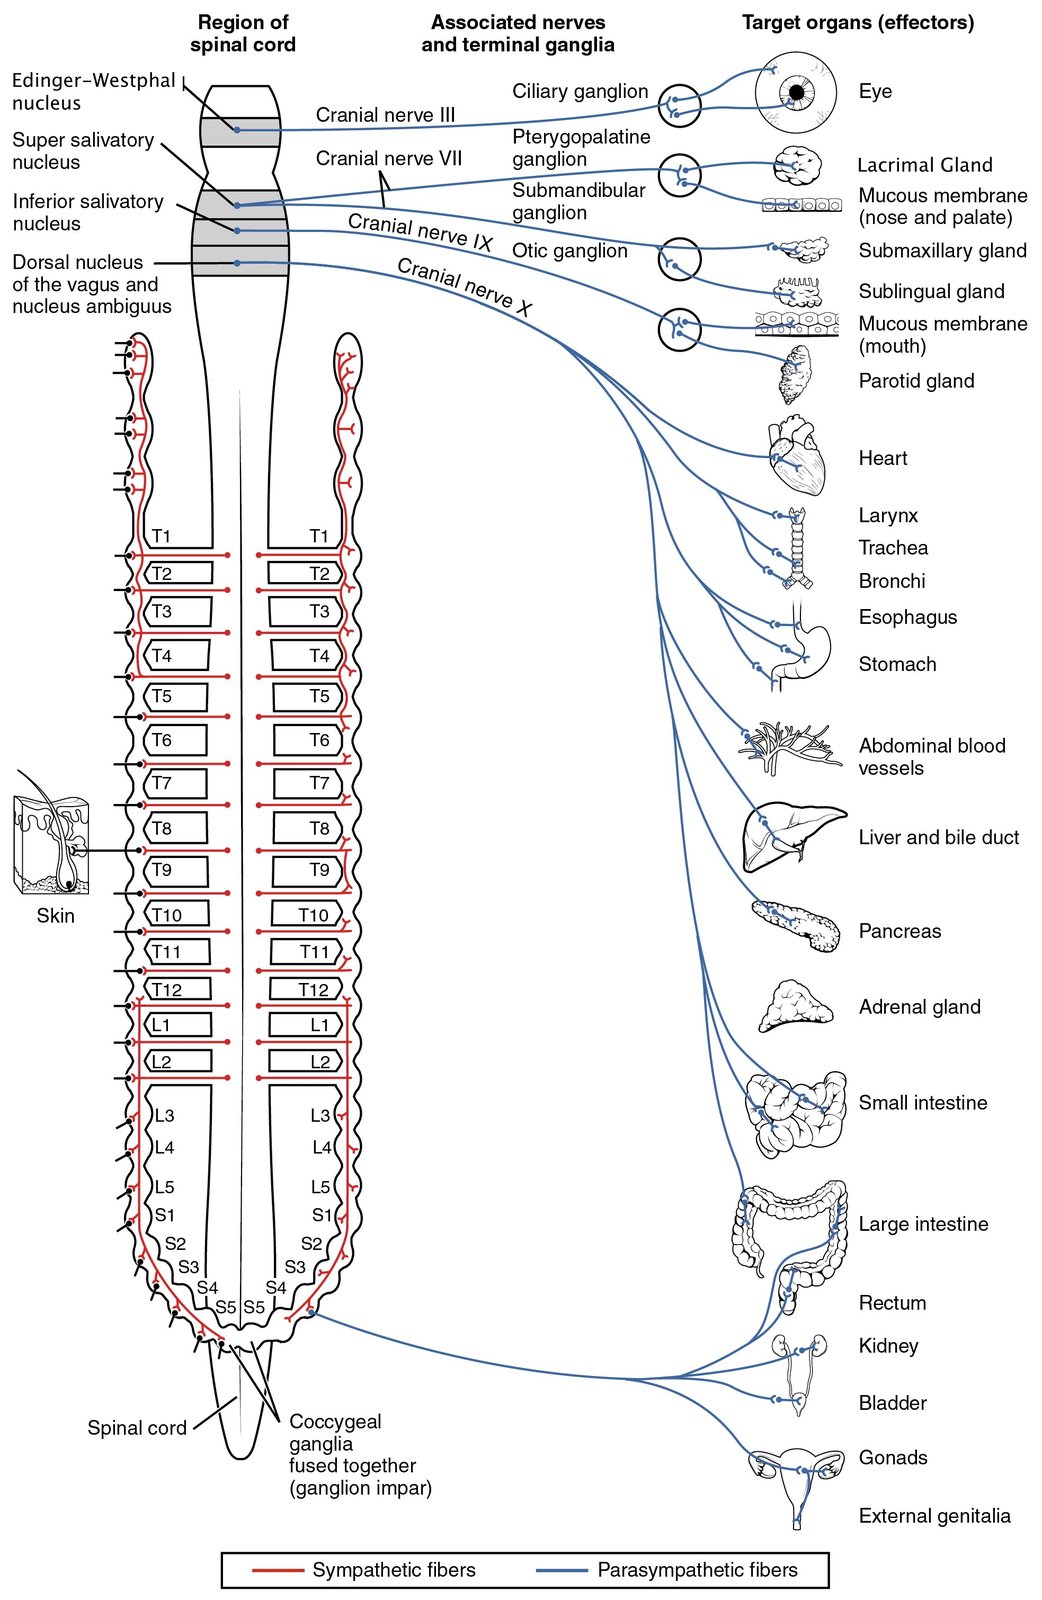
Illustration from Anatomy & Physiology.
Sympathetic effects are driven by noradrenergic signalling (norepinephrine) and tend to build over seconds to minutes. Vagal (parasympathetic) effects can act very quickly, showing up in millisecond-level changes in heart rate. This difference in timing matters when you try to link musical events to physiological responses.
Performer physiology
A musician’s physiology reflects both the immediate demands of performance and the social context around it. Heart rate and heart-rate variability (HRV) shift with arousal, emotional valence and exertion. Passages that are exciting, loud or physically demanding tend to raise heart rate and reduce short-term HRV, whereas calm, slow passages often lower heart rate and increase vagal indices (measures of parasympathetic activity). In group settings such as choirs and ensembles, cardiac patterns frequently show increased coherence or synchrony, an effect that grows with familiarity with the piece, empathic engagement, ensemble role and acoustic intensity.
Breathing is tightly coupled to musical structure and to vocal production, so respiratory measures are especially informative for singers and wind-instrument players. Phrase boundaries, tempo and expressive demands shape inhalation timing, lung volume and the balance of rib-cage and abdominal movement. These changes influence vocal physiology and electroglottographic signals (recordings of vocal-fold contact during singing). Performers also use breathing as a coordination signal. Timed inhalations and exhalations cue entrances and phrasing and help align timing across an ensemble, so respiration recordings can reveal both individual performance strategies and group coordination.
Rhythm and metre provide a scaffold for sensorimotor coupling that links movement, breathing and cardiac timing (see time and rhythm). Musical pulses can entrain interbeat intervals (IBIs), gait-like motions, and respiration, so that physiological rhythms lock to beat or phrase structure. How strongly this happens depends on rhythmic salience, motor engagement (such as tapping or conducting) and attentional focus. Phrase and tonal structure—topics in harmony and melody—also shape where listeners feel peaks of tension and release, which in turn can modulate autonomic responses.
Dig deeper: entrainment across physiological timescales
Entrainment was introduced in time and rhythm as coupled oscillators falling into a stable phase relationship, and applied there to attention and movement. What is new here is which oscillator is doing the coupling. In physiology, bodily rhythms—neural oscillations, respiration, heart rate, motor activity—come to track an external auditory pulse, or each other, through sensorimotor coupling and autonomic adjustment. The observable effects are respiratory and cardiac phase alignment to tempo, and neural phase-locking to rhythmic structure.
The practical consequence is a spread of timescales that the musical case does not have. Entrainment here runs from millisecond neural synchrony through second-scale breathing changes to minute-scale autonomic shifts, so the lag between a musical event and its physiological trace depends on which signal you are recording. Strength still depends on the same factors as before: stimulus salience, attention, and motor involvement, plus the individual’s baseline rhythms.
Dig deeper: hormones and neurotransmitters
Beyond autonomic timing, musical engagement evokes neurochemical and hormonal responses that shape affect and social bonding. Dopaminergic reward signalling and other neurotransmitter effects, oxytocin-linked social affiliation and cortisol changes tied to stress or performance anxiety can all accompany strong musical experiences and modulate the size and persistence of physiological synchrony.
Context and individual differences shape these responses. Social variables (familiarity, empathy, hierarchy within an ensemble) and performer characteristics (training, fitness, attention and recent exertion) bias both the direction and the magnitude of what we measure.
Perceiver physiology
Research now documents physiological responses to music among listeners. Slow tempi, soft dynamics, smooth timbres and a lower spectral centroid (less energy in the high frequencies, giving a darker sound) tend to promote parasympathetic dominance, including reduced heart rate, increased HRV, and lower tonic and phasic skin conductance (the slow background level and the quick event-linked peaks; both return below). Fast tempi, greater loudness, sharp attacks and high-energy spectral content favour sympathetic activation, including elevated heart rate, reduced HRV, and higher skin conductance levels.
As with performers, rhythmic regularity and tempo are strong entrainment cues for respiration and cardiac timing. Steady, slower musical pulses can slow breathing and enhance respiratory sinus arrhythmia (RSA), producing beat-to-beat vagal modulation of the heart, while faster rhythms typically speed up respiration and heart rate and can reduce vagal indices. Entrainment strength depends on rhythmic salience and the listener’s attentional engagement.
Emotional appraisal of music contributes independently, through valence and arousal pathways. Music experienced as relaxing or pleasant biases towards parasympathetic engagement, whereas highly arousing, suspenseful, or threatening passages drive sympathetic responses.
Response variability comes down to individual differences and situational factors. Baseline autonomic tone (vagal tone), musical training, familiarity, cultural background, current fitness and affective state all alter sensitivity to musical features. So does social context, along with how attention, expectation, memory and surprise change the magnitude and timing of autonomic responses. Live or collective settings amplify shared autonomic dynamics and increase inter-participant synchronisation through social engagement and multimodal cues.
Interpersonal physiological responses
Advances in measurement now allow empirical study of interpersonal physiological responses to music. As noted above, music can bring bodies into sync, both in performance and in perception. A common beat can make people breathe together, and once breathing is shared, heart rate, skin conductance and even brain activity can start to look more similar across listeners or performers.
A few simple routes lead here. Sensorimotor entrainment (sensorimotor synchronisation) means that moving, tapping or dancing together aligns bodily rhythms. Emotional contagion describes how emotion spreads through a group and shifts autonomic signals like heart rate and skin conductance. Social appraisal and hormonal responses—for example feeling connected or safe, sometimes linked to oxytocin—can also increase physiological similarity.
Dig deeper: measuring physiological coupling
We measure such interpersonal responses by looking for moment-to-moment similarity between signals such as heart rate and respiration. Common tools are cross-correlation (checking whether two signals rise and fall together, possibly with a delay), windowed coherence or windowed correlation (testing similarity in short time windows to see when coupling appears), and phase-locking (checking whether rhythmic signals keep a stable phase relationship). Because these signals run continuously, a good analysis says when people are coordinated, not only whether they are on average; Upham & McAdams (2018) developed such an activity analysis for continuous responses to music.
In a RITMO study of expert and student string quartets, the players’ cardiac rhythms became more interrelated in passages of shared musical absorption Høffding et al., 2023. Audiences can be measured too. At a Danish String Quartet concert that was also livestreamed, the audience in the hall felt more connected to each other than the streaming audience did, although both felt equally connected to the performers, and the hall audience moved less during the classical pieces and more during the folk tunes Swarbrick & Vuoskoski, 2023. Coupling tends to be stronger when people interact directly, attend to the same thing, or are emotionally engaged with the music.
Music and emotion
The signals described so far rarely appear on their own. A rising heart rate or a burst of sweat usually accompanies an emotional experience, so it is worth pausing to ask what an emotion actually is. In psychology, an emotion is a relatively brief, intense reaction to something that matters to us, combining a subjective feeling, bodily changes, and often an urge to act. Hearing a sudden bang behind you, for example, joins the feeling of alarm to a racing heart and an impulse to duck. Emotions differ from moods, which last longer and are less clearly tied to a specific cause.
For music, one distinction matters more than any other: perceived versus induced emotion Juslin, 2019. Perceived emotion is what you recognise the music as expressing. Induced (or felt) emotion is what the music makes you feel. Most listeners agree that a ballad such as Adele’s “Someone Like You” expresses sadness. Whether it makes you feel sad is a different question, and many people instead report feeling moved, comforted, or pleasantly melancholic. The two often overlap, but they can come apart, and every study of musical emotion has to state which of them it is measuring.
Mapping emotions: the valence–arousal plane
Emotions can be described with categories (happy, sad, angry, tender) or with dimensions. The most widely used dimensional model in music research is the circumplex model of affect, also called the valence–arousal model, proposed by the American psychologist James A. Russell Russell, 1980. It arranges emotional states in a circle around two axes: valence, running from unpleasant to pleasant, and arousal, running from calm to activated (see emotion classification). Happiness is pleasant and activated, sadness unpleasant and calm, anger unpleasant and activated, and relaxation pleasant and calm.
The model is popular because two numbers are enough to place a track, or a single moment within it, on a map. The figure below shows one possible placement of some well-known tracks. Your own placements would differ, which is itself a finding, since the map describes responses rather than properties of the audio file.
Source
import matplotlib.pyplot as plt
plt.rcParams.update({
    "font.size": 10,
    "axes.titlesize": 11,
    "axes.labelsize": 10,
    "xtick.labelsize": 9,
    "ytick.labelsize": 9,
    "legend.fontsize": 9,
    "figure.figsize": (10, 4),
    "figure.dpi": 100,
    "savefig.dpi": 150,
    "axes.spines.top": False,
    "axes.spines.right": False,
})

tracks = {
    "Happy\n(Pharrell Williams)": (0.9, 0.6),
    "Crazy in Love\n(Beyoncé)": (0.6, 0.85),
    "Smells Like Teen Spirit\n(Nirvana)": (-0.2, 0.9),
    "Killing in the Name\n(Rage Against the Machine)": (-0.55, 0.75),
    "Someone Like You\n(Adele)": (-0.7, -0.3),
    "when the party's over\n(Billie Eilish)": (-0.45, -0.6),
    "Blue in Green\n(Miles Davis)": (0.25, -0.55),
    "Weightless\n(Marconi Union)": (0.55, -0.85),
}

fig, ax = plt.subplots(figsize=(10, 6))
for label, (v, a) in tracks.items():
    ax.plot(v, a, "o", color="tab:blue", markersize=6)
    ax.annotate(label, (v, a), textcoords="offset points", xytext=(0, 8),
                ha="center")
ax.axhline(0, color="grey", lw=0.8)
ax.axvline(0, color="grey", lw=0.8)
ax.text(-1.15, 1.15, "angry / tense", style="italic", color="grey", ha="left")
ax.text(1.15, 1.15, "happy / excited", style="italic", color="grey", ha="right")
ax.text(-1.15, -1.2, "sad / gloomy", style="italic", color="grey", ha="left")
ax.text(1.15, -1.2, "calm / relaxed", style="italic", color="grey", ha="right")
ax.set_xlim(-1.2, 1.2)
ax.set_ylim(-1.3, 1.3)
ax.set_xticks([-1, 0, 1])
ax.set_yticks([-1, 0, 1])
ax.set_xlabel("Valence (unpleasant to pleasant)")
ax.set_ylabel("Arousal (calm to activated)")
ax.set_title("Example tracks on the valence–arousal plane (approximate placements)")
plt.tight_layout()
plt.show()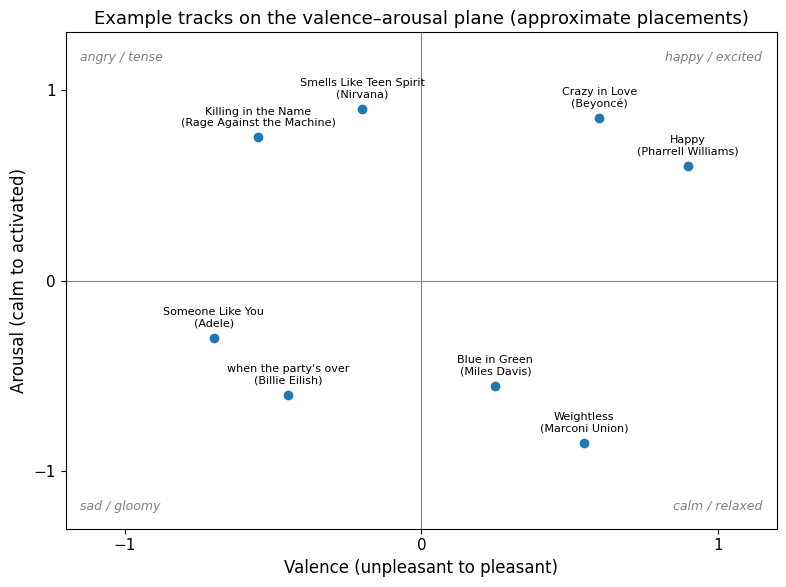
How music evokes emotions
A map says where an emotion sits, not how the music got you there. The Swedish music psychologist Patrik Juslin has argued that musical emotions arise through a set of underlying psychological mechanisms, each of which also operates outside music Juslin, 2019Juslin & Sloboda, 2010. The main ones are worth knowing:
- Brain stem reflex: Sudden, loud, or sharp events trigger the body’s fast alarm circuits. A gunshot-like drum hit, or the drop in an EDM track, startles the body before any thinking has happened.
- Rhythmic entrainment: Bodily rhythms lock onto a strong external pulse, as in the choir case above. A steady four-on-the-floor beat can wind arousal up over several minutes on a dance floor.
- Evaluative conditioning: A piece heard repeatedly in happy settings eventually triggers the happiness by itself, a musical form of classical conditioning. The chime of an ice-cream van can still cheer up an adult decades later.
- Emotional contagion: We catch the emotion the music expresses, much as emotion spreads between people (see the interpersonal section above). A voice cracking with grief in a ballad can pull the listener’s own state along with it.
- Visual imagery: Music conjures mental images, and the emotion follows the image. A slowly swelling synthesiser pad may evoke a sunrise, together with the calm that belongs to it.
- Episodic memory: Music tied to a specific episodic memory reawakens the feelings of that moment, which is why couples speak of “our song”.
- Musical expectancy: Music sets up predictions and then confirms, delays, or violates them, and those prediction errors are felt as tension, surprise, and release Huron, 2006.
Several mechanisms can run at once, and different mechanisms dominate for different listeners and situations. That is one reason the same song can give one person chills and leave another cold. The list also explains why perceived and induced emotion can part ways. You can recognise the grief in a ballad through contagion without feeling it yourself, or feel a surge of joy from an episodic memory attached to a song that expresses nothing joyful at all.
Sad music is the classic test case for these mechanisms. Jonna Vuoskoski and Tuomas Eerola showed with indirect measures that sad music induces genuine sadness rather than only a recognition of it Vuoskoski & Eerola, 2012, and that the people who enjoy sad music tend to score high on empathy and openness to experience Vuoskoski et al., 2012. Empathy also predicts how strongly a listener catches the emotion that music expresses, which is one reason the contagion mechanism varies so much from person to person.
Measuring musical emotions
Measuring an emotion is harder than measuring a heartbeat. The most direct tool is self-report: asking listeners to rate valence and arousal, pick emotion words, or move a slider while the music plays. Self-report reaches the felt experience, but it depends on memory and vocabulary, and continuous rating is itself a task that changes the listening. The physiological signals covered in the next section offer a complement, since they run continuously, do not interrupt the music, and cannot be embellished afterwards. Their weakness is the opposite one. No single signal maps neatly onto an emotion, because a racing heart can mean joy, fear, or a flight of stairs. Careful studies therefore combine both kinds of measure, and state clearly whether participants report what the music expresses or what they themselves feel.
Dig deeper: which emotion model to use
Which emotion words or dimensions to offer is itself a research question. A comparison of the discrete model (happy, sad, tender, fearful, angry) with the dimensional one (valence, arousal) on the same film music excerpts found both workable, with the dimensional model coping better with ambiguous examples Eerola & Vuoskoski, 2011. Continuous ratings add the time dimension. When several hundred listeners rated moment by moment how moved they felt, the experience showed the same pattern of appraisals and bodily sensations as being moved by social scenes in film, which supports the view of feeling moved as a social emotion Vuoskoski et al., 2022.
Such measurements can also leave the lab. In our collaboration with the Stavanger Symphony Orchestra, we have brought these methods into school concerts, recording performers’ heart rate and respiration during full orchestral pieces. As part of this work we have also experimented with an emotion visualiser, turning audience responses into graphics that can be shown and discussed with the pupils. The invisible link between music and feeling then becomes something a school class can see and argue about.
Strong musical emotions sometimes come with an unmistakable bodily signature, and one of them has received particular attention.
Experiencing chills
Interest has grown in recent years in musical chills (frisson), brief peak-emotional responses often reported as goosebumps, shivers, or a cold sensation along the spine. These events come with transient autonomic signatures such as brief rises in skin conductance, short-lived heart-rate and respiration changes, pupil dilation and visible piloerection (hair standing on end), and neuroimaging work links them to reward circuits (e.g., the nucleus accumbens). The pupil response is large enough to serve as a marker: in a study at the University of Oslo, listeners’ pupils dilated at the moments in the music where they reported chills, most strongly for music they had chosen themselves Laeng et al., 2016. Chills are typically triggered by salient musical features—unexpected harmonic shifts, climactic crescendos, intimate vocal timbres, or passages tied to personal memories—and they vary widely across listeners depending on personality, familiarity, context and attention. Note how these triggers echo the mechanisms above, with expectancy, episodic memory, and contagion doing much of the work.
Tingling sensations
Autonomous sensory meridian response (ASMR) is another phenomenon that has drawn attention in recent years. It refers to a set of pleasurable, often tingling sensations and deep relaxation brought on by soft, intimate auditory and multimodal cues—whispering, close-mic breathing, gentle tapping, slow movements and binaural spatialisation—that overlap with some musical timbral and production techniques. The video below, ASMR For People Who Don’t Get Tingles by the creator Jojo’s ASMR, demonstrates several of these triggers:
(If the video is unavailable, try the archived page.)
In sound and music research, ASMR is relevant because its triggers show how micro-acoustic features (low-level dynamics, spectral detail, and spatial cues) and a sense of interpersonal closeness modulate autonomic state. Many listeners report calming, parasympathetic effects (slower breathing, lowered heart rate) alongside transient markers such as piloerection and occasional phasic skin-conductance rises.
ASMR and frisson can co-occur, but they differ phenomenologically and physiologically. ASMR is typically soothing and prolonged, whereas frisson is brief and strongly reward-linked. Analyses should therefore treat them as distinct response classes and include timing, valence and arousal measures to tell their profiles apart.
Measuring physiological reactions
Many physiological signals can be recorded. Here we look at some of the more common ones used in music research.
Heart activity
There are two main ways to measure heart activity. The classic approach records the electrical signal using electrocardiography (ECG). Electrodes placed on the chest pick up the electrical signal of each heartbeat, which can be described as a PQRST signal, where the distance between the R peaks (the R–R interval) gives the heart rate.
Source
import numpy as np
import matplotlib.pyplot as plt
plt.rcParams.update({
    "font.size": 10,
    "axes.titlesize": 11,
    "axes.labelsize": 10,
    "xtick.labelsize": 9,
    "ytick.labelsize": 9,
    "legend.fontsize": 9,
    "figure.figsize": (10, 4),
    "figure.dpi": 100,
    "savefig.dpi": 150,
    "axes.spines.top": False,
    "axes.spines.right": False,
})

# An idealised ECG: each wave is a Gaussian bump with a typical timing (s), width (s), and height (mV)
# relative to the R peak. Two beats 0.85 s apart give a heart rate of about 70 bpm.
waves = {"P": (-0.16, 0.025, 0.15), "Q": (-0.025, 0.008, -0.10), "R": (0.0, 0.010, 1.0),
         "S": (0.025, 0.008, -0.25), "T": (0.30, 0.050, 0.30)}
fs, r_times = 1000, [0.6, 1.45]
t = np.arange(0, 2.2, 1 / fs)
ecg = np.zeros_like(t)
for r in r_times:
    for centre, width, height in waves.values():
        ecg += height * np.exp(-((t - r - centre) ** 2) / (2 * width ** 2))

fig, ax = plt.subplots(figsize=(10, 4))
ax.plot(t, ecg, color="C0", lw=1.5)
ax.set_xlabel("Time (s)"); ax.set_ylabel("Voltage (mV)")
ax.set_xlim(0.2, 2.2); ax.set_ylim(-0.85, 1.35)
r = r_times[0]
offsets = {"P": (0, 0.07), "Q": (-0.035, -0.02), "R": (0, 0.07), "S": (0.035, -0.02), "T": (0, 0.07)}   # label positions
for name, (centre, width, height) in waves.items():                 # label each wave of the first beat
    dx, dy = offsets[name]
    ax.annotate(name, (r + centre + dx, height + dy), ha="center", va="center", fontsize=11, fontweight="bold")

def bracket(x0, x1, y, label, below=True):
    """A horizontal bracket between x0 and x1 at height y, with a label."""
    tick = 0.04
    ax.plot([x0, x0, x1, x1], [y + tick, y, y, y + tick] if below else [y - tick, y, y, y - tick], color="0.3", lw=1)
    ax.text((x0 + x1) / 2, y - 0.02 if below else y + 0.03, label, ha="center", va="top" if below else "bottom", fontsize=9, color="0.3")

p_on, q_on, s_off, t_off = r - 0.21, r - 0.04, r + 0.045, r + 0.40
bracket(p_on, q_on, -0.34, "PR interval")
bracket(q_on, s_off, -0.34, "QRS")
bracket(q_on, t_off, -0.62, "QT interval")
bracket(r_times[0], r_times[1], 1.2, "R–R interval (heart rate = 60 / R–R)", below=False)
ax.set_title("An idealised ECG: the waves of one heartbeat and the intervals read from them")
plt.tight_layout()
plt.show()
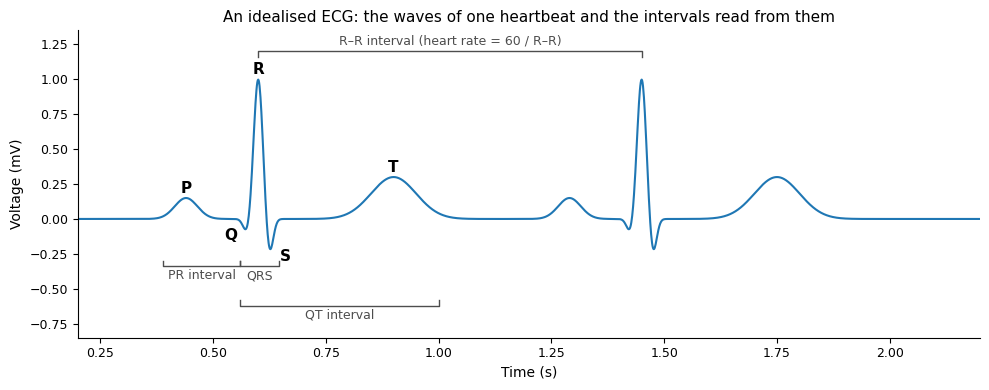
Figure: An idealised ECG trace of two heartbeats, drawn from Gaussian bumps at typical timings. The P wave is the atria contracting, the QRS complex the ventricles contracting, and the T wave the ventricles recovering. The PR interval, the QRS width, and the QT interval are what a clinician reads; the R–R interval between beats is what music research mostly uses, since it gives the heart rate and its variability.
Many people now wear watches with built-in photoplethysmography (PPG), which measures heart rate using optical sensors. These are flexible, since they can measure at the wrist, finger or ear. But they are more sensitive to motion than ECG and less reliable for short-term HRV or spectral analyses. As a rule of thumb, use ECG when you need a clean, high-quality signal, and PPG when simple heart-rate tracking is enough.
You can try PPG with nothing but a phone. The Camera pulse app reads the pulse from a fingertip pressed over the camera lens, or, more weakly, from the changing colour of the face in a webcam image, and shows the pulse wave, the heart rate, and a rough estimate of its variability. It also shows why the rule of thumb above holds: a moving finger or a change in the light breaks the signal at once.
Heart rate (HR) is conventionally reported in beats per minute (bpm). Typical resting adult HR is around 60–100 bpm (well-trained athletes commonly 40–60 bpm; infants and children are considerably higher), and HR can change by a few to several tens of bpm with arousal, movement or exercise. So it is worth recording a baseline heart rate and using within-participant normalisation to account for differences in resting HR and fitness.
Heart-rate variability (HRV) adds complementary information about autonomic balance. Because it varies so much with heart rate, always analyse it alongside respiration and/or motion data, so you can tell autonomic effects apart from metabolic or motor ones.
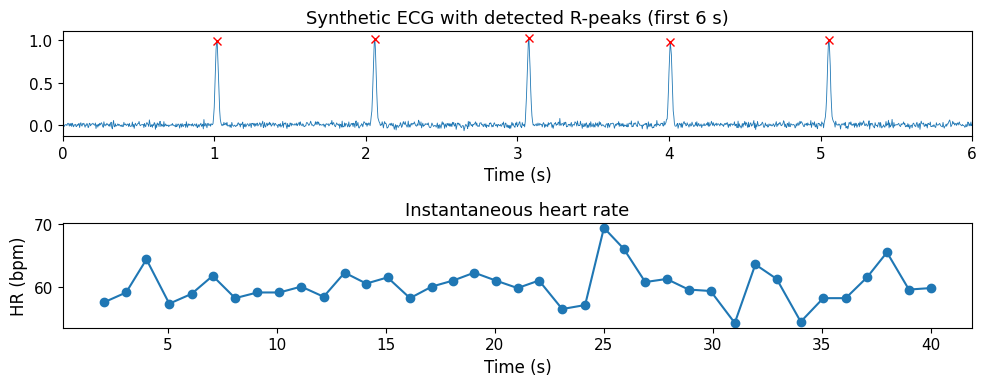
Heart rate is read off the time between successive R-peaks in the ECG. The variability of those intervals (HRV) carries autonomic information. Below we synthesise an ECG with realistic beat-to-beat variation, detect the peaks, and compute mean HR plus two common HRV measures, SDNN and RMSSD (roughly, the overall spread of the intervals and the typical size of beat-to-beat jumps).
Source
import numpy as np
from scipy.signal import find_peaks
import matplotlib.pyplot as plt
plt.rcParams.update({
    "font.size": 10,
    "axes.titlesize": 11,
    "axes.labelsize": 10,
    "xtick.labelsize": 9,
    "ytick.labelsize": 9,
    "legend.fontsize": 9,
    "figure.figsize": (10, 4),
    "figure.dpi": 100,
    "savefig.dpi": 150,
    "axes.spines.top": False,
    "axes.spines.right": False,
})

rng = np.random.default_rng(1)
fs = 250
n_beats = 40
rr = np.clip(1.0 + 0.05 * rng.standard_normal(n_beats), 0.6, 1.4)   # RR intervals (s)
peak_times = np.cumsum(rr)

t = np.arange(0, peak_times[-1] + 1.0, 1 / fs)
ecg = sum(np.exp(-((t - pt) ** 2) / (2 * 0.01 ** 2)) for pt in peak_times)
ecg += 0.02 * rng.standard_normal(len(t))

peaks, _ = find_peaks(ecg, height=0.5, distance=int(0.4 * fs))
rr_det = np.diff(t[peaks])
print(f"Detected {len(peaks)} beats | mean HR {60 / rr_det.mean():.1f} bpm")
print(f"SDNN {1000 * rr_det.std():.1f} ms | RMSSD {1000 * np.sqrt(np.mean(np.diff(rr_det) ** 2)):.1f} ms")

fig, ax = plt.subplots(2, 1, figsize=(10, 4))
ax[0].plot(t, ecg, lw=0.6)
ax[0].plot(t[peaks], ecg[peaks], "rx")
ax[0].set_xlim(0, 6)
ax[0].set_title("Synthetic ECG with detected R-peaks (first 6 s)")
ax[0].set_xlabel("Time (s)")
ax[1].plot(t[peaks][1:], 60 / rr_det, "o-")
ax[1].set_title("Instantaneous heart rate")
ax[1].set_xlabel("Time (s)")
ax[1].set_ylabel("HR (bpm)")
plt.tight_layout()
plt.show()
Detected 40 beats | mean HR 60.0 bpm
SDNN 47.5 ms | RMSSD 65.8 ms
Respiration
Respiration is the record of how people breathe. The main variables to look at are breathing rate (breaths per minute), tidal depth (how big each breath is), the timing of inhalation versus exhalation, and instantaneous breathing phase (where in the breath cycle you are at any moment). Typical resting adult values: breathing rate ≈ 12–20 breaths/min, tidal volume ≈ 400–600 mL per breath, and an inspiratory:expiratory ratio around 1:2 (inspiration ≈ 1.5–2.0 s, expiration ≈ 2.5–3.5 s at ~12 bpm).
A common respiration device is the spirometer, which gives precise measurements of air flow and volume. It requires a mouthpiece, though, so it is not very practical for musical purposes. A respiratory inductance plethysmography (RIP) belt is more practical, as it fits around the chest. It captures respiration phase and timing well, but is less accurate for absolute lung volume.
Breathing can also be read from motion. A phone lying flat on the chest or belly records the rise and fall of each breath with its built-in accelerometer, and a webcam sees the same movement of the shoulders and chest. The Breathing monitor app uses either source to draw the breathing waveform, mark each breath, and estimate the rate, which is close to what a belt measures and far from what a spirometer measures: the movement of the chest, not the air that moves.
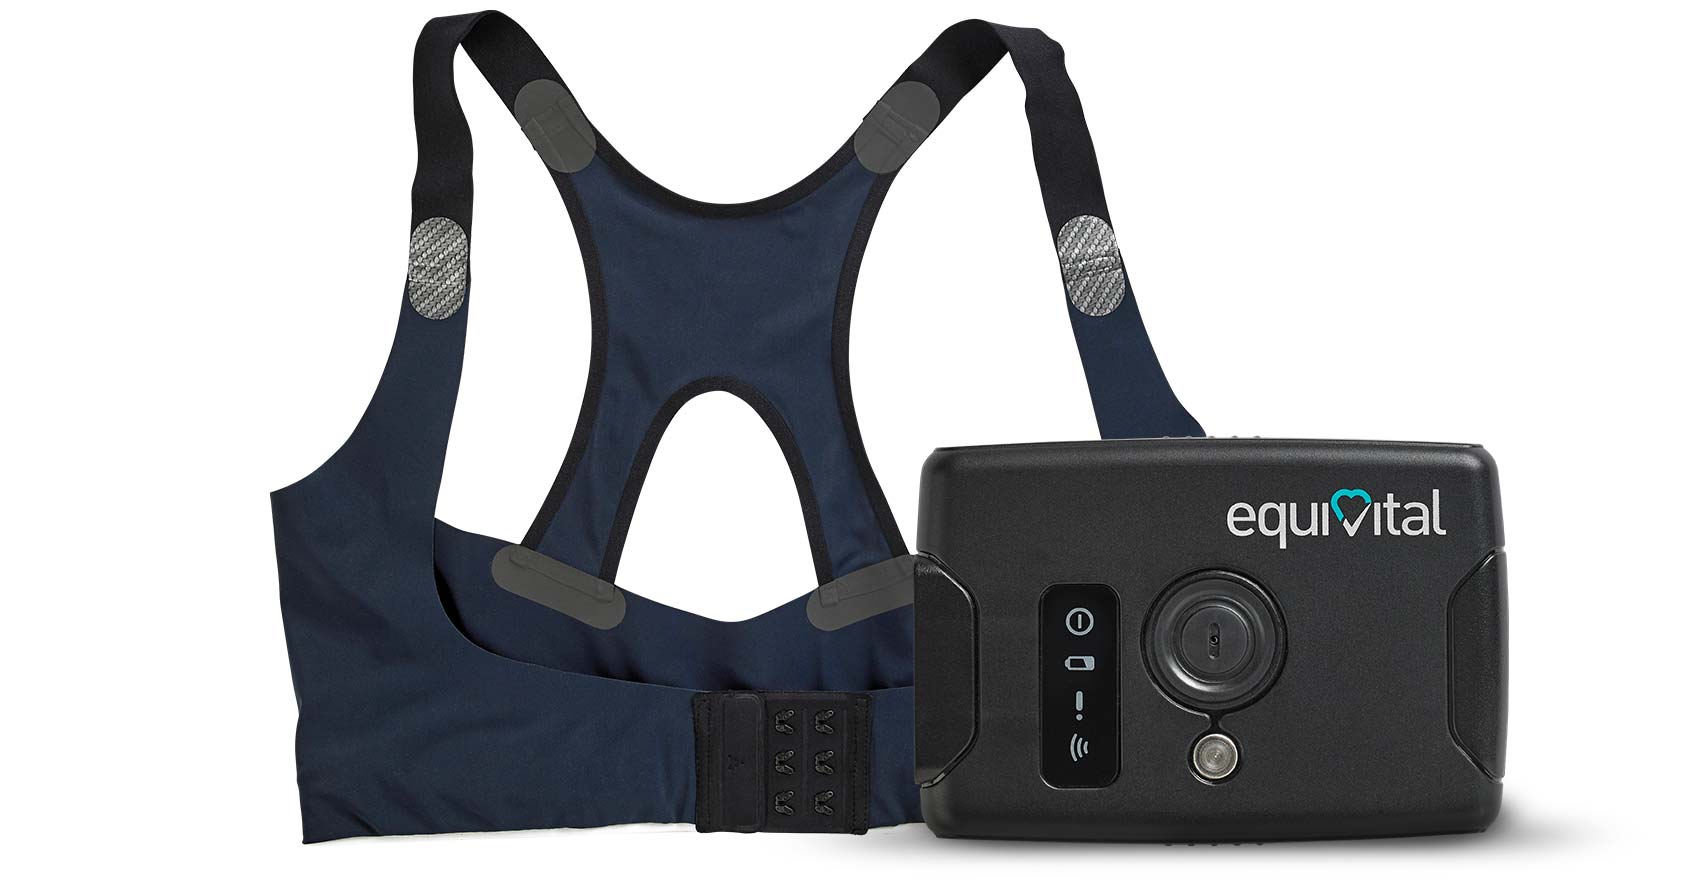
We have a large number of EQ02 LifeMonitor sensor vests from Equivital that measure respiration, heart rate, and accelerometry in one device.
Body temperature
Body temperature has not traditionally been studied much in music research. Some research groups can now capture it with sensor vests, though, so it is becoming possible to study it. Medical applications often measure temperature rectally or tympanically, but for musical purposes skin temperature is more relevant, and there the relative change matters more than the absolute value. Skin temperature also changes slowly, over seconds to minutes, so expect gradual trends rather than sharp, moment-to-moment peaks in response to musical events.
We have also started capturing body temperature with thermal cameras. One benefit is that a single camera can cover a large group, such as a whole orchestra or audience. Since these cameras only record temperature, they also effectively anonymise the data. Until recently their resolution was too poor to be useful, but the latest cameras offer full HD resolution, which makes them far more useful for analysis.
Skin conductance
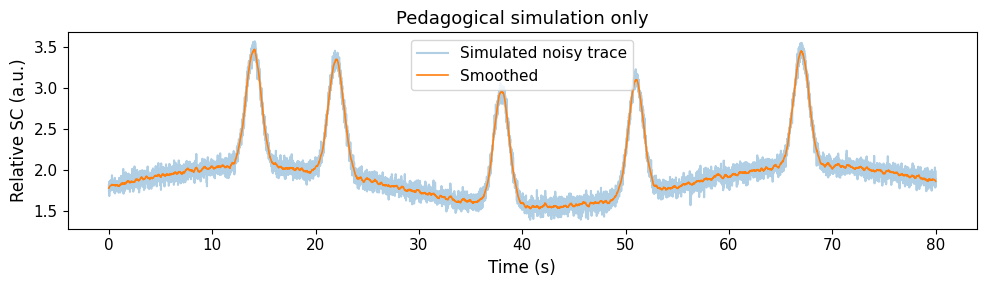
Skin conductance (also called electrodermal activity, EDA) is a simple way to index sympathetic arousal. When people are surprised, excited, or stressed, sweat-gland activity changes and the skin conducts electricity differently. In recordings we separate a slow baseline level (skin conductance level, SCL) from quick event-linked peaks (skin conductance responses, SCRs). In music studies you typically expect SCR peaks after surprising or high-arousal moments, and SCL shifts when arousal stays elevated.
EDA is best captured from stable sites such as the palms, where the signal is strongest. The participant should sit still, because motion makes the signal noisy. It also helps to record and report the likely confounds—room temperature and humidity, skin hydration, electrode placement, movement, and relevant medications—and to correct statistically for multiple trials or comparisons where needed.
The simulated trace below is a toy skin-conductance signal for practising the tonic and phasic vocabulary, not a measurement: a slowly drifting level with short bursts on top.
Source
import numpy as np
from scipy.signal import savgol_filter
import matplotlib.pyplot as plt
plt.rcParams.update({
    "font.size": 10,
    "axes.titlesize": 11,
    "axes.labelsize": 10,
    "xtick.labelsize": 9,
    "ytick.labelsize": 9,
    "legend.fontsize": 9,
    "figure.figsize": (10, 4),
    "figure.dpi": 100,
    "savefig.dpi": 150,
    "axes.spines.top": False,
    "axes.spines.right": False,
})

rng = np.random.default_rng(42)
t = np.linspace(0, 80, 8000)
tonic = 1.8 + 0.25 * np.sin(2 * np.pi * t / 55.0)
phasic = np.zeros_like(t)
for centre in (14.0, 22.0, 38.0, 51.0, 67.0):
    phasic += 1.4 * np.exp(-((t - centre) ** 2) / 1.1)
noise = 0.06 * rng.standard_normal(len(t))
raw = tonic + phasic + noise
smooth = savgol_filter(raw, window_length=51, polyorder=3)

fig, ax = plt.subplots(figsize=(10, 3))
ax.plot(t, raw, alpha=0.35, label="Simulated noisy trace")
ax.plot(t, smooth, lw=1.2, label="Smoothed")
ax.set_xlabel("Time (s)")
ax.set_ylabel("Relative SC (a.u.)")
ax.set_title("Pedagogical simulation only")
ax.legend()
plt.tight_layout()
plt.show()
Muscle tension
Electromyography (EMG) measures the tiny electrical signals produced by muscle activation, and is commonly used to track the timing and amplitude of motor events. In music research it helps separate motor activity (playing an instrument, singing, tapping, or expressive facial movements) from autonomic responses like heart rate or skin conductance.
Typical EMG recordings use surface bipolar electrodes placed on the skin over the muscle of interest. Raw EMG is noisy, so preprocessing matters, and you need to watch how motion influences the result. With good filtering, though, EMG yields meaningful data. At UiO we have also explored using EMG data in various kinds of interactive music systems, as shown in the fourMs Lab video MuMyo - exploring the Myo armband for musical interaction:
(If the video is unavailable, try the archived page.)
Interpreting the signals
A recording is only the start. The signals above differ in what they index, how fast they change, and how easily they are disturbed, and the same trace can be read in several ways. This section compares them and lists the mistakes that are easiest to make.
Comparison
The table below compares the signals discussed above: what each one captures, how fast it varies, and its strengths and limitations.
Dig deeper: sampling rates for body signals
The column on signal content explains the sampling recommendations. The sampling theorem from the electroacoustics chapter applies to body signals exactly as it does to audio: the sampling rate must be at least twice the highest frequency in the signal. In practice, physiological recording often samples far above that minimum, since many analyses need precise event timing rather than just the waveform. Heartbeats arrive only about once per second, but locating each R peak to within a millisecond, which heart rate variability analysis requires, calls for ECG sampled at hundreds of hertz.
| Signal | What it indexes | Typical sensors / form | Signal content (Hz) | Recommended sampling (Hz) | Notes (strengths / limitations) |
|---|---|---|---|---|---|
| ECG / PPG | Cardiac timing, heart rate, HRV | ECG chest electrodes or adhesive leads; PPG wrist/finger/ear optical | beats at roughly 1–3; HRV bands 0.04–0.4; ECG waveform detail up to ~150; PPG pulse wave up to ~15 | ECG: 250–1000; PPG: 50–200 | ECG = gold standard for precise R‑peaks & HRV; PPG easier/wearable but motion‑sensitive and less accurate for short‑term HRV |
| GSR / EDA | Sympathetic arousal, sweat‑gland activity (SCL, SCR) | Ag/AgCl electrodes on palmar/plantar sites | below ~1; tonic level drifts under 0.05; phasic responses rise and fall over 1–5 s | 10–50 (higher for fine phasic timing) | Direct index of sympathetic activity; slow tonic changes and phasic SCRs; sensitive to temperature, humidity, contact quality and movement |
| Respiration | Breathing rate, depth, phase (RSA) | RIP belts, nasal cannula, capnography, impedance | roughly 0.15–0.5 at rest (9–30 breaths per minute), up to ~1 during exertion | 25–100 | Essential to separate RSA from HRV; belt signals robust but can slip; nasal sensors more precise but intrusive |
| Skin temperature | Peripheral vasoconstriction/vasodilation, thermoregulation | Thermistors, thermocouples, infrared sensors (skin sites) | below ~0.1; changes unfold over minutes | 1–10 | Reflects slow vasomotor changes; strongly affected by ambient conditions and clothing; useful for longer trends, not phasic responses |
| EMG | Muscle activation, tension, facial expressions, vocal‑tract activity | Surface bipolar electrodes (or intramuscular for depth) | surface EMG carries most energy at 20–450 | ≥1000 (typical) | High temporal resolution to dissociate motor from autonomic effects; requires careful placement, normalisation, and artefact control (crosstalk, movement) |
At RITMO, most of our studies compare heart rate (from ECG), respiration (from RIP belts), temperature (from belts or thermal cameras), and muscle activation (from EMG). We also always record these together with accelerometry and audio/video documentation, so that we can correct for contextual factors.
None of these signals are easy to work with. Each one takes a good deal of pre-processing and analysis before it yields meaningful results. The payoff is that we can learn a lot about how people experience sound and music, with signals that are at least easier to interpret than brain measurements.
Pitfalls, ethics, and everyday sensors
Physiological traces are easy to misread. Movement—tapping, posture shifts, speech—contaminates PPG and adds noise to ECG. Poor electrode contact and temperature swings produce artefactual steps in skin conductance, and slow drift in peripheral temperature can track clothing, room ventilation, and vasoregulation as much as it tracks the music. Before interpreting phasic responses, then, prefer within-participant baselines, time-lock events to musical structure, and co-register movement or video where you can.
Consumer wearables—watches, rings, earbuds with heart-rate sensing—make ecological measurement easy, but they usually cannot substitute for research-grade ECG, belt-based respiration, or lab EDA when you need precise timing, validated HRV, or a stable tonic estimate. Treat their output as a source of trends and prompts, not as automatic ground truth.
Even “peripheral” sensing produces personal data, so ethics matters here. Use informed consent that states the purpose, storage, sharing and withdrawal terms; protect the files under your institution’s rules; and avoid diagnostic language about individuals based on a single session. Classroom demonstrations should be clear about their limits and should not single people out. First-person and interpretive accounts often complement the traces; see the critical and qualitative methods discussed in the Introduction.
A critical look: singing together, breathing together
When a Swedish choir study made the news, the headlines said that singing together makes the singers’ hearts beat as one, and the story has since been retold as proof that music bonds people at the level of the body. The study behind the headlines, by Björn Vickhoff and colleagues at the University of Gothenburg Vickhoff et al., 2013, is worth reading for what it actually measured. The researchers asked a choir of fifteen singers to perform three tasks while their heart rate and respiration were recorded: humming a single note, singing a hymn, and chanting a slow mantra.
The result was that heart-rate variability came to share a common structure across singers, and it did so because the music told them when to breathe. Singing forces a long, controlled exhalation punctuated by short inhalations at phrase boundaries; because respiration modulates heart rate (respiratory sinus arrhythmia), a shared breathing pattern produces a shared cardiac pattern. The effect was strongest for the slow, regularly phrased mantra and weakest for the freely hummed tone.
It is worth being precise about what this shows and what it does not:
- The claim is that structured singing synchronises respiration, and through it, cardiac variability.
- The mechanism is mechanical and well understood, and it does not require any appeal to emotional bonding.
- The limit is that a correlation between bodies is not evidence of a feeling. Whether synchronised breathing causes the sense of connection that choir singers report is a separate question, and one that this design cannot answer.
That gap—between a measurable physiological effect and the experience someone reports—is where most of the interesting work in this field happens, and where most overreaching claims are made.
Later work has taken the question into the concert hall. Finn Upham’s analyses of audience video show that listeners’ bodies are shaped by the music even when they sit still, and that moments of musical silence produce a shared stilling of the whole audience Upham et al., 2024. Whether that shared stillness is felt as connection is, again, a separate question.
The study is Vickhoff et al. (2013), and it is openly available if you want to see how such an experiment is reported.
- Upham, F., & McAdams, S. (2018). Activity Analysis and Coordination in Continuous Responses to Music. Music Perception, 35(3), 253–294. 10.1525/mp.2018.35.3.253
- Høffding, S., Yi, W., Lippert, E., Sanchez, V. G., Bishop, L., Laeng, B., Danielsen, A., Jensenius, A. R., & Wallot, S. (2023). Into the Hive-Mind: Shared Absorption and Cardiac Interrelations in Expert and Student String Quartets. Music & Science, 6, 20592043231168597. 10.1177/20592043231168597
- Swarbrick, D., & Vuoskoski, J. K. (2023). Collectively Classical: Connectedness, Awe, Feeling Moved, and Motion at a Live and Livestreamed Concert. Music & Science, 6, 20592043231207595. 10.1177/20592043231207595
- Juslin, P. N. (2019). Musical Emotions Explained: Unlocking the Secrets of Musical Affect. Oxford University Press. 10.1093/oso/9780198753421.001.0001
- Russell, J. A. (1980). A Circumplex Model of Affect. Journal of Personality and Social Psychology, 39(6), 1161–1178. 10.1037/h0077714
- Juslin, P. N., & Sloboda, J. A. (Eds.). (2010). Handbook of Music and Emotion: Theory, Research, Applications. Oxford University Press. 10.1093/acprof:oso/9780199230143.001.0001
- Huron, D. (2006). Sweet Anticipation: Music and the Psychology of Expectation. The MIT Press. 10.7551/mitpress/6575.001.0001
- Vuoskoski, J. K., & Eerola, T. (2012). Can sad music really make you sad? Indirect measures of affective states induced by music and autobiographical memories. Psychology of Aesthetics, Creativity, and the Arts, 6(3), 204–213. 10.1037/a0026937
- Vuoskoski, J. K., Thompson, W. F., McIlwain, D., & Eerola, T. (2012). Who Enjoys Listening to Sad Music and Why? Music Perception, 29(3), 311–317. 10.1525/mp.2012.29.3.311
- Eerola, T., & Vuoskoski, J. K. (2011). A comparison of the discrete and dimensional models of emotion in music. Psychology of Music, 39(1), 18–49. 10.1177/0305735610362821
- Vuoskoski, J. K., Zickfeld, J. H., Alluri, V., Moorthigari, V., & Seibt, B. (2022). Feeling moved by music: Investigating continuous ratings and acoustic correlates. PLOS ONE, 17(1), e0261151. 10.1371/journal.pone.0261151
- Laeng, B., Eidet, L. M., Sulutvedt, U., & Panksepp, J. (2016). Music chills: The eye pupil as a mirror to music’s soul. Consciousness and Cognition, 44, 161–178. 10.1016/j.concog.2016.07.009
- Vickhoff, B., Malmgren, H., \AAström, R., Nyberg, G., Ekström, S.-R., Engwall, M., Snygg, J., Nilsson, M., & Jörnsten, R. (2013). Music Structure Determines Heart Rate Variability of Singers. Frontiers in Psychology, 4, 334. 10.3389/fpsyg.2013.00334
- Upham, F., Høffding, S., & Rosas, F. E. (2024). The Stilling Response: From Musical Silence to Audience Stillness. Music & Science, 7, 20592043241233422. 10.1177/20592043241233422