Electroacoustics is the branch of acoustics concerned with converting sound into electrical signals and back again, through devices such as microphones, loudspeakers, and amplifiers. It underpins nearly all modern music making, recording, and reproduction, and it is where the four levels of description cross from the physical signal into the digital representation; every choice in a microphone or converter (sample rate, bit depth, codec) decides what survives that crossing.
A brief history
The field of electroacoustics began in the late nineteenth century. Alexander Graham Bell’s telephone (1876) showed that speech could be turned into an electrical signal and sent down a wire. Thomas Edison’s phonograph (1877) showed that sound could be recorded and played back mechanically. The carbon microphone, the vacuum tube amplifier, and the moving-coil loudspeaker, all developed in the early twentieth century, made electrical sound reproduction practical. Katz (2022) gives a short account of how these developments reshaped music.
The condenser microphone arrived in the 1920s. Magnetic recording, FM radio, and high-fidelity audio in the mid-twentieth century then transformed music production and broadcasting. Today the field keeps changing through digital signal processing, microelectronics, and wireless transmission.
Why electroacoustics matters for music
Electroacoustics is a subdiscipline of acoustics, alongside the room and instrument acoustics we met in acoustics. The physics of sound propagation is the same, but electroacoustics adds electrical and electronic phenomena that shape how sound is captured, modified, transmitted, and reproduced.
Every recorded piece of music has passed through microphones, amplifiers, and loudspeakers, and the character of those devices shapes the timbre we hear. Live performance leans on the same equipment. In concert halls and clubs, the choice and placement of microphones and speakers decides how a performance reaches the audience. And electroacoustic instruments, from electric guitars to synthesisers, all involve electroacoustic transduction somewhere in the signal chain.
There is also a deeper point underlying these technological innovations. Recording and reproduction split sound from its source: the voice in your earbuds is not in the room with you. Schafer called this split schizophonia (see listening). What began as a technical curiosity is now the ordinary condition of musical life: most of the music we hear has no visible sound-producing action behind it, which is also why the designed action–sound mappings introduced in acoustics matter: with synthesisers and samplers, the link between a performer’s action and the resulting sound is a design decision rather than a law of physics.
Digitised audio is also the usual input to computational descriptors of pitch and harmony (see machine listening), and it connects back to the music-theoretical representations in harmony and melody.
Transduction
A transducer is any device that converts energy from one form to another. In electroacoustics, we care mainly about devices that convert between acoustic energy (pressure waves in air) and electrical energy (varying voltages or currents).
We can describe the relationship between cause and effect in an electroacoustic system as follows:
The key transducers in this chain are the microphone (acoustic → electrical) and the loudspeaker (electrical → acoustic). The intermediate stages (preamplifier, signal processing, power amplifier) operate entirely in the electrical domain.
Transduction principles
Different electroacoustic transducers exploit different physical phenomena to convert energy:
- Electromagnetic induction: a conductor moving in a magnetic field generates an electrical current (used in dynamic microphones and moving-coil loudspeakers).
- Electrostatic / capacitive: changes in the distance between two charged plates alter the capacitance and produce a voltage (used in condenser microphones and electrostatic loudspeakers).
- Piezoelectric: certain crystals and ceramics generate an electrical charge when mechanically deformed (used in contact microphones and some transducers).
- Magnetostrictive and other effects: used in some specialist transducers.
These all have trade-offs between frequency response, sensitivity, dynamic range, and cost.
An electric instrument: the Victorian synthesizer
The simplest electroacoustic instrument you can build contains three things: a 9 V battery, a bare loudspeaker element, and a couple of cables with crocodile clips. Nicolas Collins calls it the Victorian synthesizer in his book on hardware hacking, because every part of it existed in the nineteenth century Collins, 2009. Touch the free ends of the cables together and the circuit closes; the speaker gives a click. That is the whole instrument.
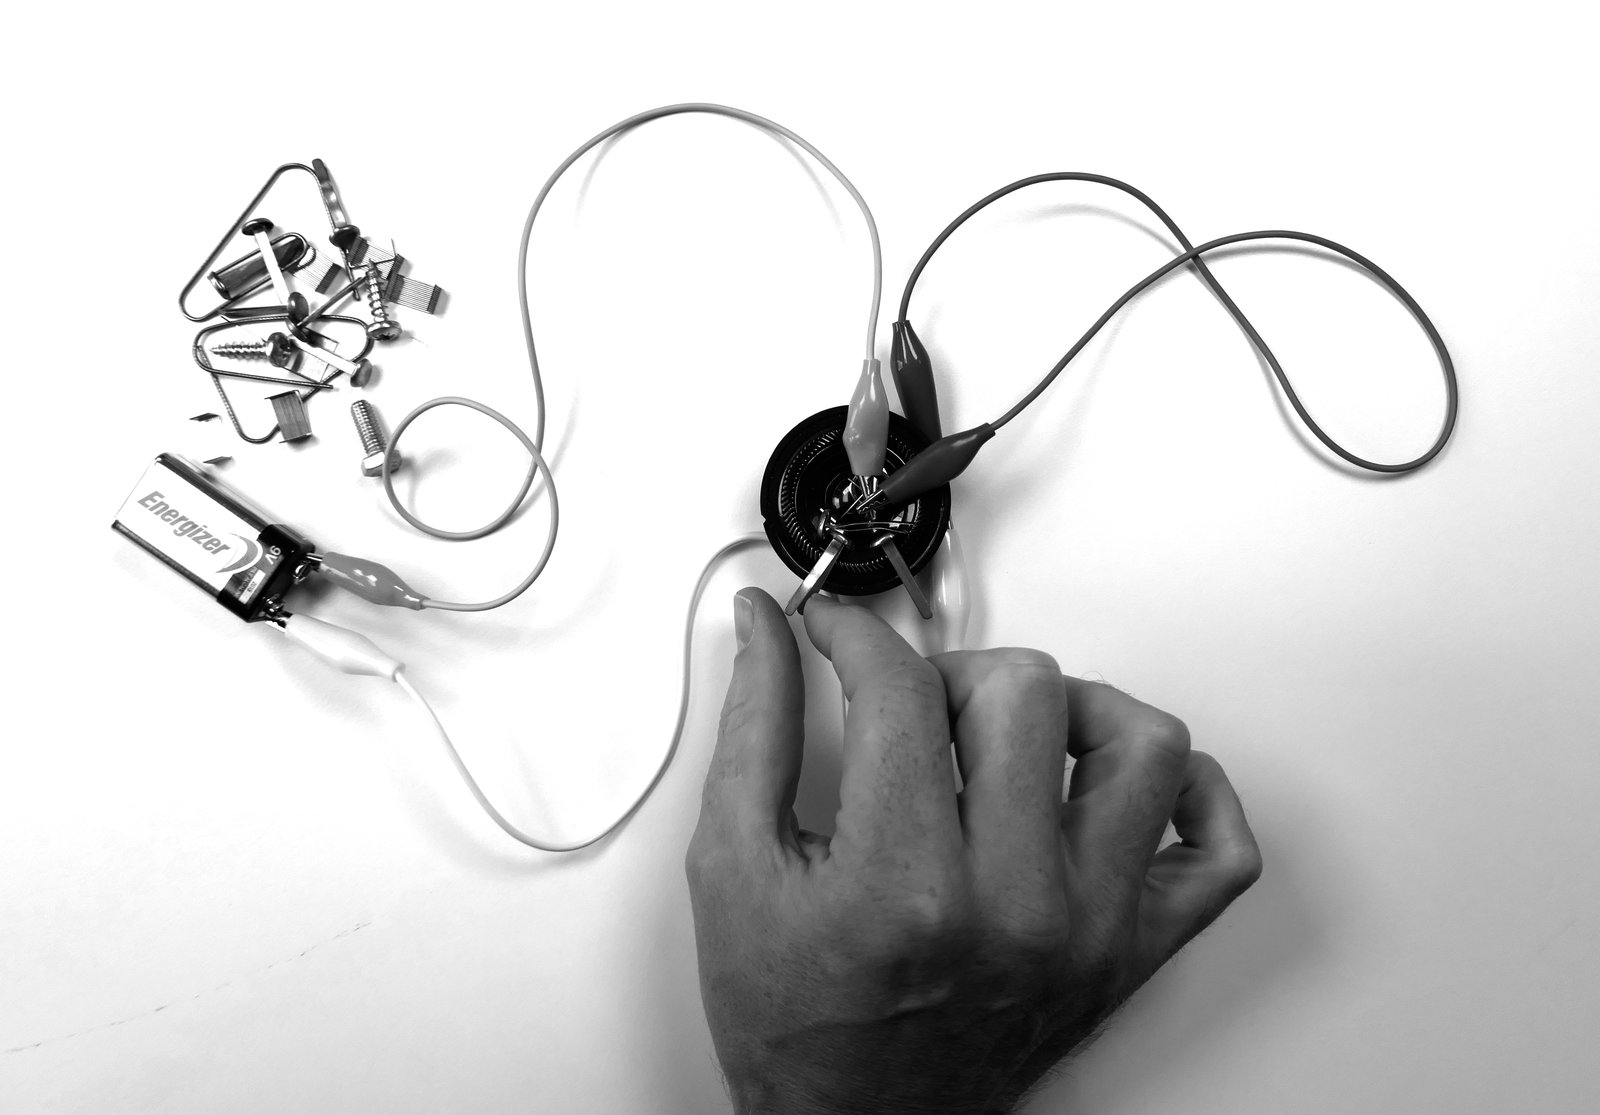
Figure: A Victorian synthesizer, played by scraping metal objects across the contacts (photo: Alexander Refsum Jensenius, from Jensenius (2022)).
The click is the moving-coil loudspeaker from later in this chapter working in its barest form. Connecting the battery sends a direct current through the voice coil, and the force between that current and the magnet pushes the cone outwards. A steady current holds the cone there in silence; the sound is made only at the moment the current changes, when the circuit is made or broken. That is why the instrument is played with paper clips, screws, and springs: dragged across the contacts they make and break the circuit many times a second, and the clicks turn into rattles and buzzes. With a little care the vibrating cone can be made to break its own contact, so that the circuit switches itself on and off and the instrument plays on its own.
We build one in class because it shows the transduction chain with nothing hidden. There is no oscillator, no amplifier, and no code, so there is nothing between the action and the sound: no latency, and you feel the cone jump under your fingers at the instant you hear it. In the terms of the acoustics chapter, the link between action and sound is a coupling rather than a designed mapping, which makes this electric instrument closer to an acoustic one than to the synthesisers described later in the chapter. Jensenius (2022) describes it as one of very few genuinely electric instruments, and as an excellent way of teaching the principles of sound technology, since everyone can make it work and a group can build surprisingly complex rhythmic machines out of a handful of parts.
Microphones
A microphone is a transducer that converts acoustic pressure variations in the surrounding air into a corresponding electrical signal. The type, quality, and placement of a microphone strongly shape the character of any recording or live sound system.
Dynamic (moving-coil) microphones
The dynamic microphone is the most widely used type in live sound. Its operating principle is electromagnetic induction:
- Sound waves cause a thin diaphragm to vibrate.
- A voice coil attached to the diaphragm moves within the field of a permanent magnet.
- This movement induces an electrical current in the coil, proportional to the velocity of the diaphragm.
Advantages: robust, tolerant of high sound pressure levels, requires no external power supply, relatively inexpensive.
Disadvantages: limited high-frequency response due to the inertia of the diaphragm and coil assembly; generally lower sensitivity than condenser microphones.
Typical examples include the Shure SM58 (vocal microphone) and Shure SM57 (instrument microphone), which are industry standards in live sound.
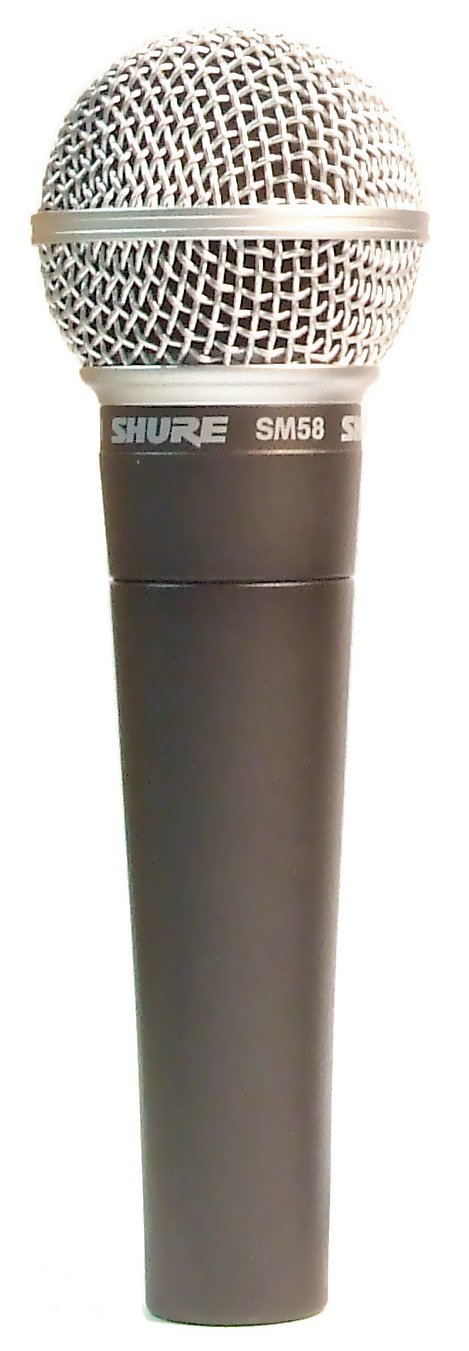
Figure: The Shure SM58, a classic dynamic stage microphone (photo: Iain Fergusson, Wikimedia Commons, CC BY 2.5).
Condenser (capacitor) microphones
The condenser microphone uses an electrostatic principle:
- The diaphragm forms one plate of a capacitor, with a fixed backplate as the other.
- The capacitor is maintained at a fixed charge (either by a battery or by phantom power supplied through the microphone cable).
- Sound waves cause the diaphragm to move, varying the distance between the plates and hence the capacitance.
- This change in capacitance at constant charge produces a varying voltage, which is the output signal.
Advantages: very flat and extended frequency response, high sensitivity, low self-noise, available in small diaphragm (pencil) and large diaphragm varieties.
Disadvantages: requires power (phantom power at 48 V, or internal battery); more fragile than dynamic microphones; more expensive.
Condenser microphones are commonly chosen for studio recording of acoustic instruments, voices, and orchestras, because their flat, extended response and low self-noise capture fine detail. Large-diaphragm condensers (e.g., Neumann U87) are a staple of professional studios.
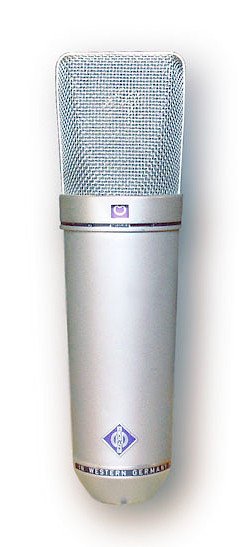
Figure: The Neumann U87, a large-diaphragm condenser studio microphone (photo: PJ, Wikimedia Commons, CC BY-SA 3.0).
Ribbon microphones
The ribbon microphone uses a thin corrugated metallic ribbon suspended in a magnetic field:
- Sound waves cause the ribbon to vibrate within the magnetic field.
- The movement of the ribbon induces a voltage by electromagnetic induction, similar to a dynamic microphone, but the ribbon itself is both the diaphragm and the conductor.
Advantages: natural and smooth high-frequency roll-off, excellent transient response, often described as having a warm and vintage sound character. Ribbon microphones are inherently bidirectional (figure-8 polar pattern).
Disadvantages: fragile ribbon element; lower output level, requiring a high-gain preamplifier; sensitive to wind and plosive sounds; some classic ribbon microphones should not be connected to phantom power (though modern active ribbon microphones require it).
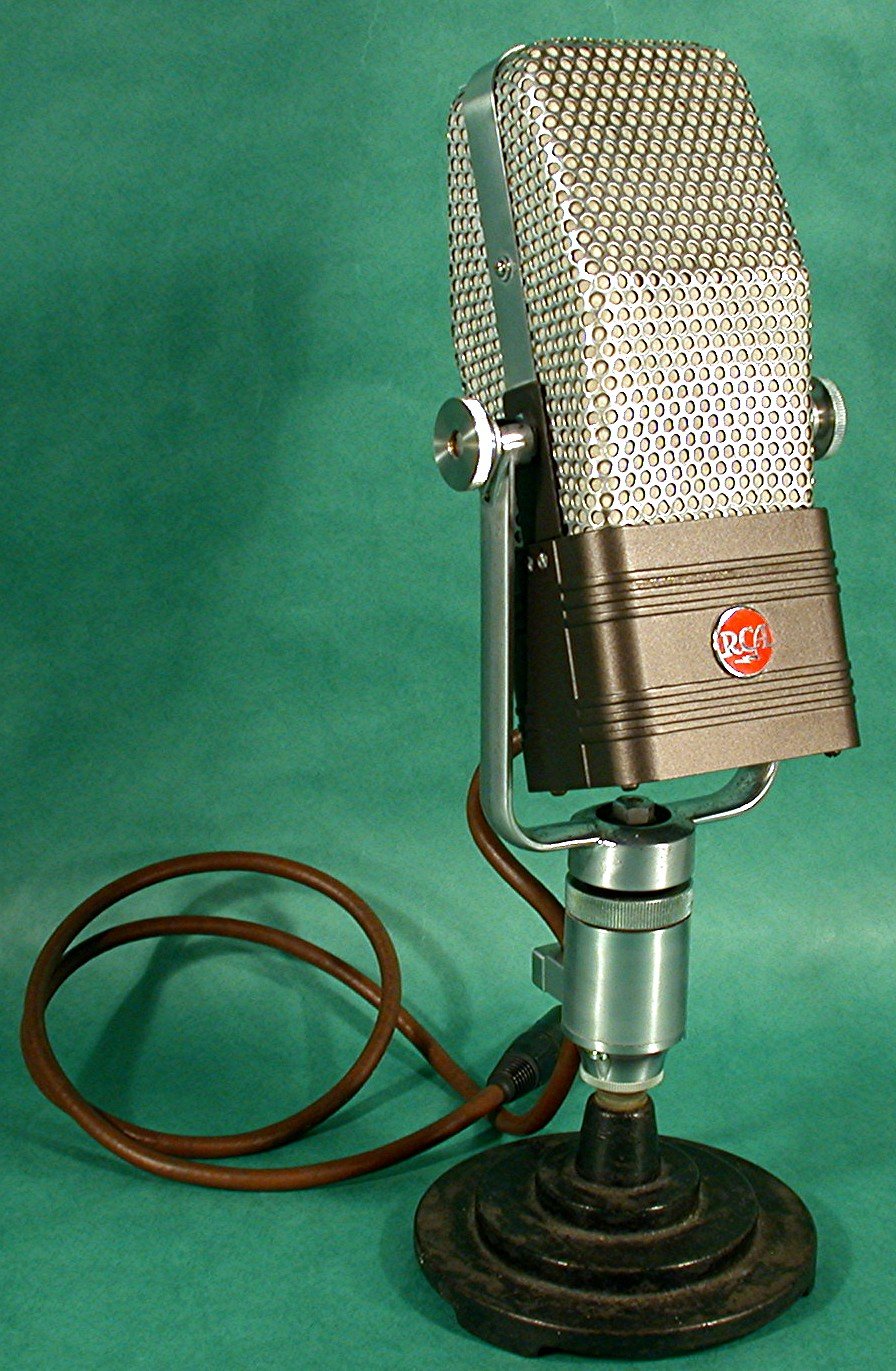
Figure: The RCA 44-BX, a classic ribbon microphone from the 1930s and 40s (photo: Roadside Guitars, Wikimedia Commons, CC BY-SA 2.0).
MEMS microphones
MEMS (Micro-Electro-Mechanical Systems) microphones are semiconductor-based transducers fabricated using integrated circuit manufacturing techniques. They are used in smartphones, laptops, hearing aids, and other consumer devices where small size matters most. Their performance has improved dramatically in recent years, and they are increasingly found in professional measurement applications as well.
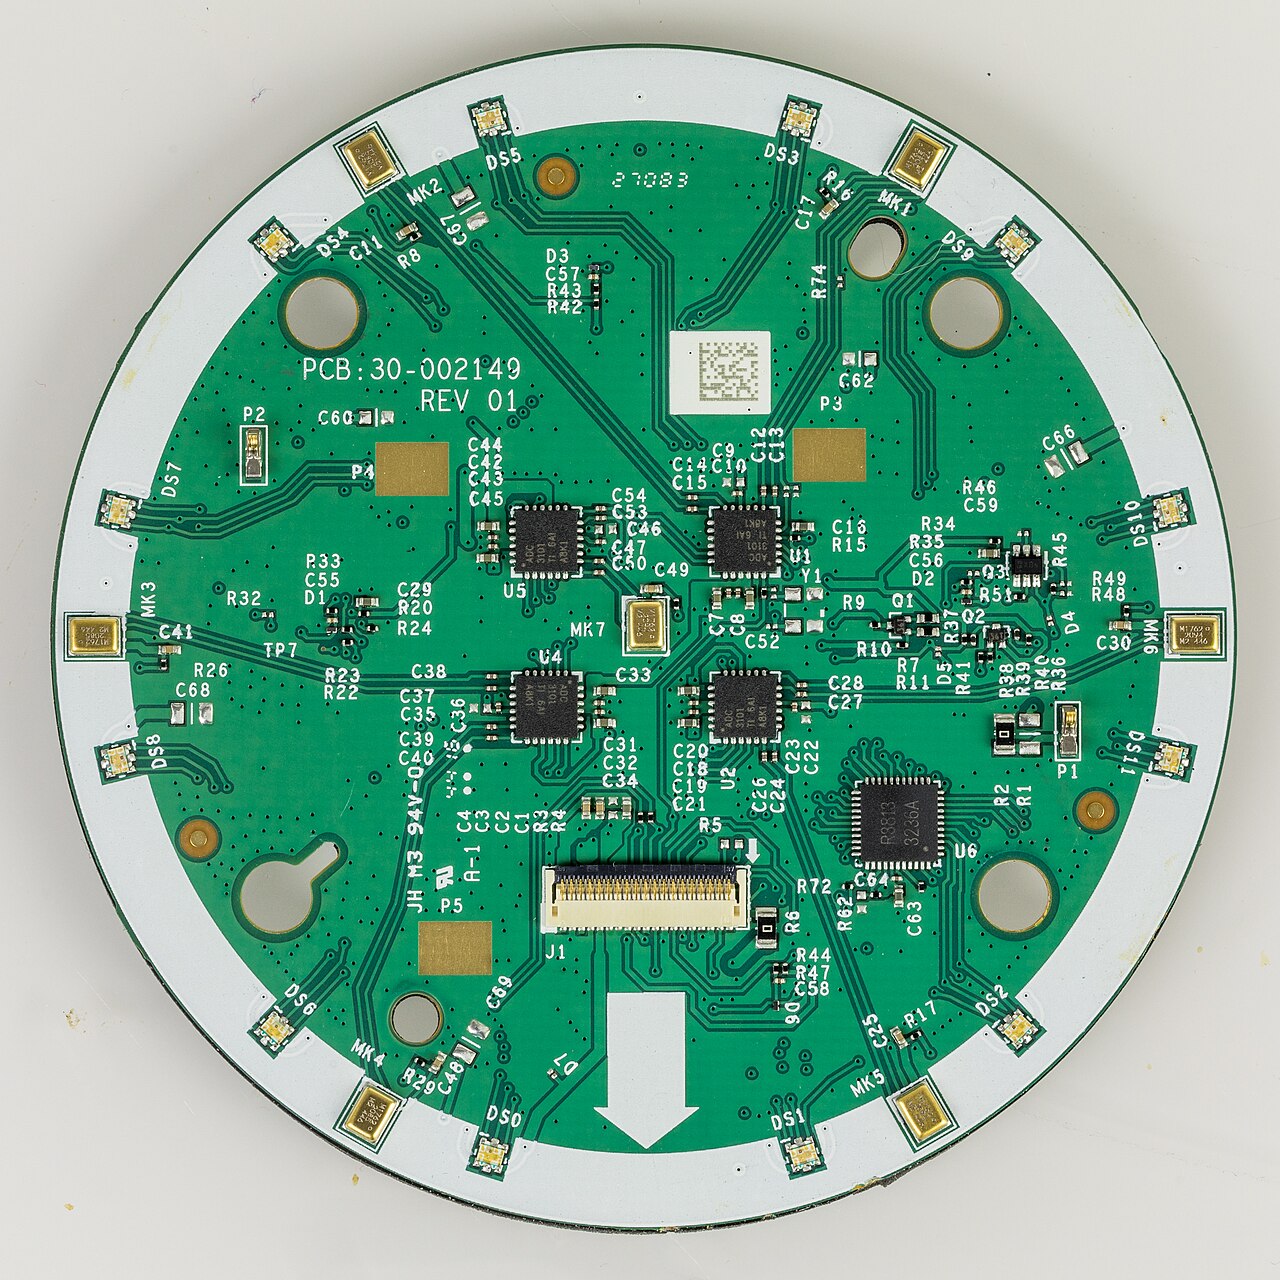
Figure: Circuit board of an Amazon Echo Dot smart speaker. The seven small metal packages around the ring (labelled MK1–MK7) are MEMS microphones, forming the array used for far-field voice pickup (photo: Raimond Spekking, Wikimedia Commons, CC BY-SA 4.0).
Microphone polar patterns
A polar pattern (or directivity pattern) describes how sensitive a microphone is to sounds arriving from different directions. It is typically represented as a plot of sensitivity versus angle, in polar coordinates.
The main polar patterns are:
- Omnidirectional: equal sensitivity in all directions. Captures the full acoustic environment, including room reflections.
- Cardioid: most sensitive in front, least sensitive at the rear (heart-shaped pattern). The most common pattern for live sound and studio recording. Offers some rejection of unwanted sounds from behind.
- Supercardioid / Hypercardioid: narrower front pickup than cardioid, with a small rear lobe. More directional; useful in noisy environments.
- Figure-8 (bidirectional): picks up equally from front and rear, with strong rejection from the sides. Used in ribbon microphones and as a component in mid-side recording techniques.
In practice, polar patterns vary with frequency. Most directional microphones are more omnidirectional at low frequencies and become more directional as frequency increases. The plots below illustrate idealised patterns.
Source
import numpy as np
import matplotlib.pyplot as plt
plt.rcParams.update({
    "font.size": 10,
    "axes.titlesize": 11,
    "axes.labelsize": 10,
    "xtick.labelsize": 9,
    "ytick.labelsize": 9,
    "legend.fontsize": 9,
    "figure.figsize": (10, 4),
    "figure.dpi": 100,
    "savefig.dpi": 150,
    "axes.spines.top": False,
    "axes.spines.right": False,
})

theta = np.linspace(0, 2 * np.pi, 360)

# Standard polar pattern formulae (values clipped at 0 for plotting)
omni        = np.ones_like(theta)
cardioid    = np.clip(0.5 + 0.5 * np.cos(theta), 0, 1)
supercard   = np.clip(0.37 + 0.63 * np.cos(theta), 0, 1)
hypercard   = np.clip(0.25 + 0.75 * np.cos(theta), 0, 1)
figure8     = np.abs(np.cos(theta))

patterns = {
    "Omnidirectional": omni,
    "Cardioid":        cardioid,
    "Supercardioid":   supercard,
    "Hypercardioid":   hypercard,
    "Figure-8":        figure8,
}

fig, axes = plt.subplots(1, 5, subplot_kw=dict(polar=True), figsize=(10, 2.5))
colors = ['steelblue', 'darkorange', 'seagreen', 'firebrick', 'purple']

for ax, (name, pattern), color in zip(axes, patterns.items(), colors):
    ax.plot(theta, pattern, color=color, linewidth=2)
    ax.fill(theta, pattern, alpha=0.15, color=color)
    ax.set_theta_zero_location('N')  # 0 degrees at the top (front of microphone)
    ax.set_theta_direction(-1)       # Clockwise
    ax.set_ylim(0, 1)
    ax.set_yticks([0.5, 1.0])
    ax.set_yticklabels([])
    ax.set_xticks(np.radians([0, 90, 180, 270]))
    ax.set_xticklabels(['0°', '90°', '180°', '270°'])
    ax.set_title(name, pad=10)

plt.suptitle('Idealised Microphone Polar Patterns', y=1.02)
plt.tight_layout()
plt.show()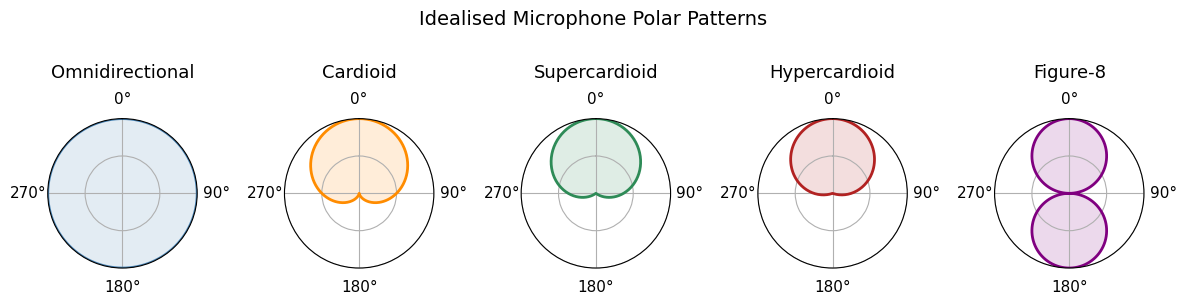
Microphone frequency response
The frequency response of a microphone describes how its output sensitivity varies across the audio frequency range. An ideal microphone would have a perfectly flat frequency response, meaning it captures all frequencies equally. In practice, every microphone design imposes some deviation from flat response.
- Dynamic microphones typically show a reduced sensitivity at high frequencies due to the inertia of the coil–diaphragm assembly, and may have a moderate presence peak (a boost around 3–8 kHz) to enhance clarity of voice or instruments.
- Condenser microphones generally provide a flatter, more extended high-frequency response. Large-diaphragm condensers often have a subtle presence peak around 8–12 kHz.
- Ribbon microphones exhibit a gentle high-frequency roll-off, which contributes to their characteristically warm sound.
At low frequencies, proximity effect is a common phenomenon in directional (cardioid, figure-8) microphones. The bass response increases when the sound source is very close to the microphone (within 30–60 cm). This effect is exploited by vocalists and broadcasters to achieve a richer, fuller sound, but can be a problem when recording at close range if unwanted bass boost is not desired.
Source
import numpy as np
import matplotlib.pyplot as plt
plt.rcParams.update({
    "font.size": 10,
    "axes.titlesize": 11,
    "axes.labelsize": 10,
    "xtick.labelsize": 9,
    "ytick.labelsize": 9,
    "legend.fontsize": 9,
    "figure.figsize": (10, 4),
    "figure.dpi": 100,
    "savefig.dpi": 150,
    "axes.spines.top": False,
    "axes.spines.right": False,
})

freq = np.logspace(np.log10(20), np.log10(20000), 1000)

def smooth_step(x, x0, width):
    """Logistic-style smooth transition centred on x0."""
    return 1 / (1 + np.exp(-(x - x0) / width))

# Simulate idealised frequency responses (in dB, relative to 1 kHz)

# Dynamic: slight presence peak ~5 kHz, high-frequency roll-off above 12 kHz
dynamic = (
    2.5 * np.exp(-((np.log10(freq) - np.log10(5000)) ** 2) / (2 * 0.15 ** 2))
    - 6 * smooth_step(np.log10(freq), np.log10(12000), 0.15)
)

# Condenser: very flat, small presence peak ~10 kHz, slight HF extension
condenser = (
    1.5 * np.exp(-((np.log10(freq) - np.log10(10000)) ** 2) / (2 * 0.2 ** 2))
    - 2 * smooth_step(np.log10(freq), np.log10(18000), 0.1)
)

# Ribbon: warm roll-off starting around 8 kHz
ribbon = (
    -0.5 * np.log10(freq / 1000)
    - 4 * smooth_step(np.log10(freq), np.log10(8000), 0.2)
)

# Low-frequency roll-off common to most mics (high-pass due to housing)
lf_rolloff = -10 * smooth_step(-np.log10(freq), -np.log10(80), 0.15)

dynamic   += lf_rolloff
condenser += lf_rolloff
ribbon    += lf_rolloff

fig, ax = plt.subplots(figsize=(10, 4))
ax.semilogx(freq, dynamic,   label='Dynamic (moving-coil)', color='steelblue',  linewidth=2)
ax.semilogx(freq, condenser, label='Condenser (capacitor)',  color='darkorange', linewidth=2)
ax.semilogx(freq, ribbon,    label='Ribbon',                 color='seagreen',   linewidth=2)
ax.axhline(0, color='grey', linestyle='--', linewidth=0.8, label='0 dB reference')
ax.set_xlim(20, 20000)
ax.set_ylim(-15, 8)
ax.set_xlabel('Frequency (Hz)')
ax.set_ylabel('Relative level (dB)')
ax.set_title('Idealised Frequency Responses of Microphone Types')
ax.set_xticks([50, 100, 200, 500, 1000, 2000, 5000, 10000, 20000])
ax.set_xticklabels(['50', '100', '200', '500', '1k', '2k', '5k', '10k', '20k'])
ax.grid(True, which='both', alpha=0.3)
ax.legend()
plt.tight_layout()
plt.show()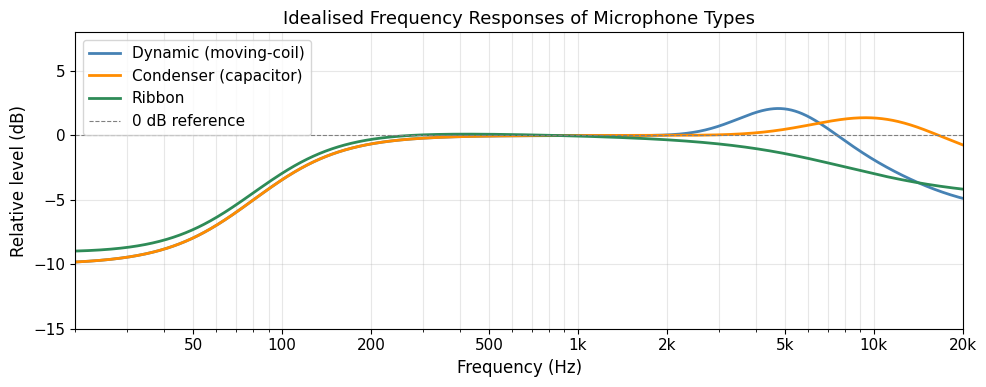
Microphone specifications
Manufacturers publish a specification sheet for every microphone. For most musical purposes four numbers do the work: how sensitive it is, how flat its frequency response is, how quiet it is when nothing is happening (self-noise), and how loud a source it can take before distorting (maximum SPL). The gap between those last two is the microphone’s usable dynamic range.
Dig deeper: the full specification sheet
| Specification | Description | Typical values |
|---|---|---|
| Sensitivity | Output voltage for a given sound pressure level (usually 1 Pa / 94 dB SPL). Higher (less negative) is more sensitive. | −60 to −30 dBV/Pa |
| Frequency response | Range and flatness of frequency coverage. | 20 Hz – 20 kHz (±3 dB) |
| Self-noise (equivalent noise level) | The inherent electronic noise of the microphone, expressed as dB SPL. Lower is better. | 10–30 dB (A-weighted) |
| Maximum SPL | The highest sound pressure level the microphone can handle before distortion. | 120–150 dB SPL |
| Dynamic range | Maximum SPL minus self-noise. | 90–130 dB |
| Polar pattern | The directional sensitivity pattern. | Omni, cardioid, figure-8, etc. |
| Output impedance | The electrical impedance of the microphone output. | 50–600 Ω (professional) |
The specification sheet is only half the story, though. Engineers do not choose an SM58 or a U87 because one is “better”; they choose a sound. Microphones colour what they capture, and those colours have become part of music history: the crooner’s intimacy is a sensitive microphone up close, and much of what we recognise as the sound of a favourite record is a chain of such choices. Reading a specification sheet tells you what a microphone can do; listening through it tells you what it does to the music.
Loudspeakers
A loudspeaker converts electrical signals into acoustic pressure variations. It is the final electroacoustic transducer in most audio reproduction systems.
Moving-coil (dynamic) loudspeakers
The moving-coil loudspeaker is by far the most common loudspeaker type. Its operation is the electromagnetic inverse of the dynamic microphone:
- An alternating electrical current flows through a voice coil suspended in a permanent magnetic field.
- The interaction of the current and the magnetic field produces a force on the coil (Lorentz force), causing it to move back and forth.
- The coil is attached to a cone (diaphragm), whose movement creates pressure waves in the surrounding air.
Most practical loudspeaker systems use several drivers, each optimised for a different frequency range:
- Woofer: handles low frequencies (bass), typically 20–500 Hz. Large diameter cone (15–40 cm) for efficient low-frequency radiation.
- Midrange driver: covers middle frequencies (500 Hz – 5 kHz), where much of the energy of speech and music is concentrated.
- Tweeter: handles high frequencies (5–20 kHz). Small diameter diaphragm (2–4 cm) for extended high-frequency response.
- Subwoofer: dedicated low-frequency driver (20–200 Hz) for cinema, music production, and concert sound reinforcement.
A crossover network routes the appropriate frequencies to each driver, ensuring that each operates within its optimal range.
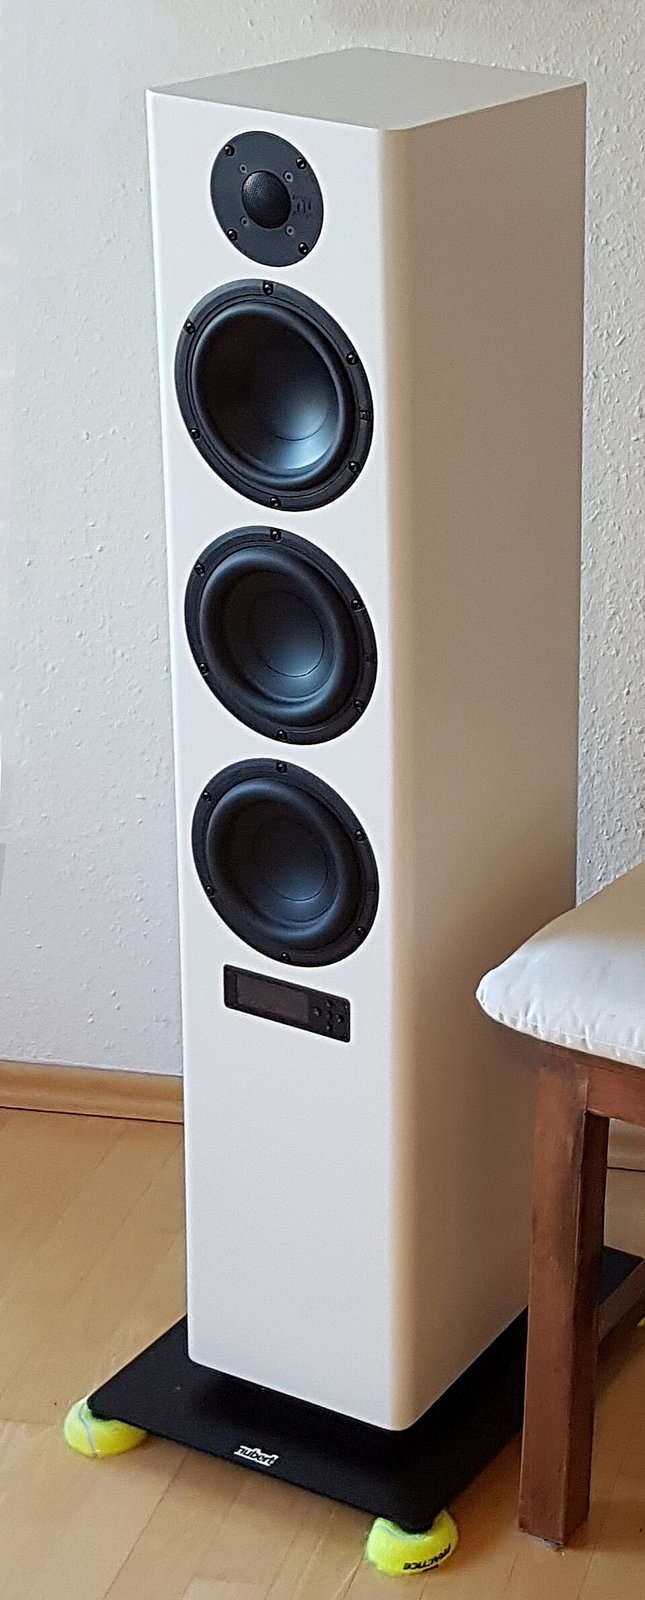
Figure: A floor-standing loudspeaker with a dome tweeter on top and three moving-coil cone drivers below (photo: Hg6996, Wikimedia Commons, CC BY-SA 4.0).
Electrostatic loudspeakers
Electrostatic loudspeakers use the same capacitive principle as condenser microphones, in reverse. A thin conductive diaphragm is stretched between two perforated stators. A high electrical field is maintained between the stators and the diaphragm; applying an audio signal to the stators causes the diaphragm to vibrate. Electrostatic loudspeakers are valued for their extremely low distortion and transient accuracy, but are expensive, large, and require high-voltage power supplies.
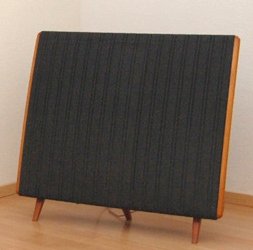
Figure: The Quad ESL-57, the first commercially successful full-range electrostatic loudspeaker (photo: Martin Niemöller, Wikimedia Commons, public domain).
Headphones and earphones
Headphones are miniature loudspeakers worn directly on or in the ears. They range from over-ear models whose pads surround the ear (good isolation, a more natural sound stage), via more compact on-ear designs, to the in-ear monitors used both on stage and in consumer earbuds. Bone-conduction headphones skip the ear canal entirely: small transducers on the cheekbones vibrate the skull, and the vibration reaches the inner ear directly.
Most headphones use dynamic (moving-coil) drivers; high-end models may use planar magnetic or electrostatic elements. The acoustics of headphones differ fundamentally from loudspeakers in a room, since headphones bypass the effects of room acoustics and the pinnae, which can affect perceived spatial image. This makes them attractive for controlled listening experiments in music psychology research, but means that recordings mixed on headphones may translate differently to loudspeakers.
Source
import numpy as np
import matplotlib.pyplot as plt
plt.rcParams.update({
    "font.size": 10,
    "axes.titlesize": 11,
    "axes.labelsize": 10,
    "xtick.labelsize": 9,
    "ytick.labelsize": 9,
    "legend.fontsize": 9,
    "figure.figsize": (10, 4),
    "figure.dpi": 100,
    "savefig.dpi": 150,
    "axes.spines.top": False,
    "axes.spines.right": False,
})

# Active noise cancellation: a second sound in opposite phase cancels the first, as long as the timing is exact.
fs = 48000
t = np.arange(0, 0.012, 1 / fs)
noise = np.sin(2 * np.pi * 120 * t) + 0.5 * np.sin(2 * np.pi * 310 * t)
anti = -noise
fig, (ax0, ax1) = plt.subplots(1, 2, figsize=(10, 4), gridspec_kw={"width_ratios": [1.3, 1]})
for k, (y, label, col) in enumerate([(noise, "noise", "C0"), (anti, "anti-noise (same sound, opposite phase)", "C1"), (noise + anti, "sum at the ear: silence", "C2")]):
    ax0.plot(t * 1000, y - 3.2 * k, color=col, lw=1.5)
    ax0.text(0, 1.6 - 3.2 * k, label, fontsize=9, va="bottom")
ax0.set_yticks([]); ax0.set_xlabel("Time (ms)"); ax0.set_title("Adding the opposite phase")
ax0.spines["left"].set_visible(False)
f = np.logspace(1, 4, 300)
for delay_us, col in [(10, "C0"), (50, "C1"), (200, "C2")]:
    residual = 20 * np.log10(np.maximum(2 * np.abs(np.sin(np.pi * f * delay_us * 1e-6)), 1e-6))   # remaining level, dB re the noise
    ax1.plot(f, residual, color=col, lw=1.5, label=f"timing error {delay_us} µs")
ax1.axhline(0, color="0.5", ls="--", lw=1); ax1.text(12, 1, "no reduction", fontsize=8, color="0.4")
ax1.set_xscale("log"); ax1.set_ylim(-45, 8); ax1.set_xlabel("Frequency (Hz)"); ax1.set_ylabel("Remaining noise (dB)")
ax1.set_title("Why cancellation works best at low frequencies"); ax1.legend(loc="lower right")
plt.tight_layout()
plt.show()
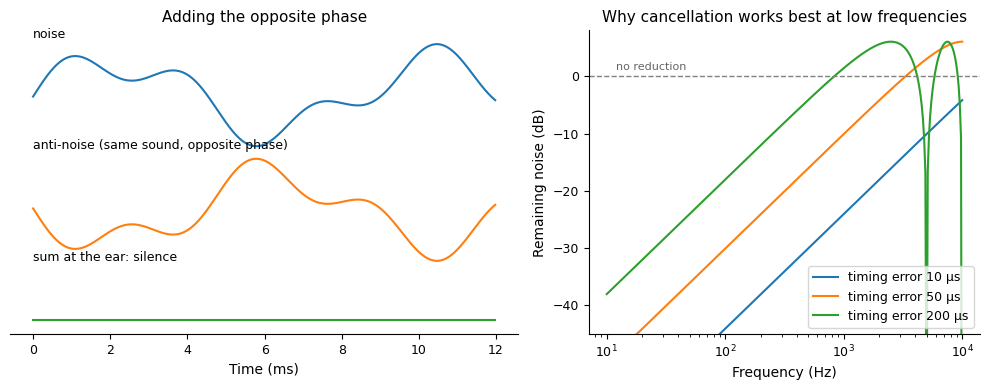
Figure: Active noise cancellation. Left: a noise, the same sound in opposite phase, and their sum, which is silence. Right: cancellation only works if the anti-noise arrives at exactly the right moment; the curves show how much noise remains when the timing is off by 10, 50, and 200 microseconds. A 200 µs error still removes most of a 100 Hz hum but nothing at 1 kHz, which is why noise-cancelling headphones silence engines and ventilation and leave voices alone.
Headphone listening also deserves a moment of reflection. For most people today, most music arrives through earbuds. This is a private, portable listening situation that is completely differnt than how music has been experienced throughout human history. The sound appears inside the head rather than at a place in the room, nobody around you knows what you are hearing, and the music travels with you in changing environments and contexts. This creates a very different listening experience than when playing, listening, moving (including dancing) together. This is important to reflecton on when we study music and its effects.
Loudspeaker frequency response and sensitivity
Like microphones, loudspeakers are characterised by their frequency response. Unlike microphones, achieving a flat frequency response across the full audio range from a single transducer is very difficult, which is why multi-driver systems with crossovers are standard.
The sensitivity of a loudspeaker is typically specified as the sound pressure level (in dB SPL) produced at a distance of 1 metre when driven with 1 watt (or 2.83 V into an 8 Ω load). A loudspeaker with higher sensitivity requires less amplifier power to achieve a given sound pressure level.
The plot below shows idealised frequency responses for different loudspeaker configurations, illustrating how each driver covers a different portion of the audio spectrum.
Source
import numpy as np
import matplotlib.pyplot as plt
plt.rcParams.update({
    "font.size": 10,
    "axes.titlesize": 11,
    "axes.labelsize": 10,
    "xtick.labelsize": 9,
    "ytick.labelsize": 9,
    "legend.fontsize": 9,
    "figure.figsize": (10, 4),
    "figure.dpi": 100,
    "savefig.dpi": 150,
    "axes.spines.top": False,
    "axes.spines.right": False,
})

freq = np.logspace(np.log10(20), np.log10(20000), 1000)

def bandpass_response(f, f_low, f_high, slope_low=24, slope_high=24):
    """Simulate a bandpass driver response with gentle Butterworth-like slopes."""
    low_shelf  = 1 / np.sqrt(1 + (f_low / f) ** slope_low)
    high_shelf = 1 / np.sqrt(1 + (f / f_high) ** slope_high)
    return 20 * np.log10(low_shelf * high_shelf + 1e-10)

subwoofer  = bandpass_response(freq, 25,   200,  slope_low=24, slope_high=12)
woofer     = bandpass_response(freq, 50,   1000, slope_low=12, slope_high=12)
midrange   = bandpass_response(freq, 300,  5000, slope_low=12, slope_high=12)
tweeter    = bandpass_response(freq, 3000, 22000, slope_low=12, slope_high=24)

fig, ax = plt.subplots(figsize=(10, 4))
ax.semilogx(freq, subwoofer, label='Subwoofer (20–200 Hz)',     color='navy',       linewidth=2)
ax.semilogx(freq, woofer,    label='Woofer (50 Hz – 1 kHz)',    color='steelblue',  linewidth=2)
ax.semilogx(freq, midrange,  label='Midrange (300 Hz – 5 kHz)', color='darkorange', linewidth=2)
ax.semilogx(freq, tweeter,   label='Tweeter (3–20 kHz)',        color='firebrick',  linewidth=2)
ax.axhline(-3, color='grey', linestyle='--', linewidth=0.8, label='−3 dB point')
ax.set_xlim(20, 20000)
ax.set_ylim(-40, 5)
ax.set_xlabel('Frequency (Hz)')
ax.set_ylabel('Relative level (dB)')
ax.set_title('Idealised Frequency Responses of Loudspeaker Drivers')
ax.set_xticks([50, 100, 200, 500, 1000, 2000, 5000, 10000, 20000])
ax.set_xticklabels(['50', '100', '200', '500', '1k', '2k', '5k', '10k', '20k'])
ax.grid(True, which='both', alpha=0.3)
ax.legend()
plt.tight_layout()
plt.show()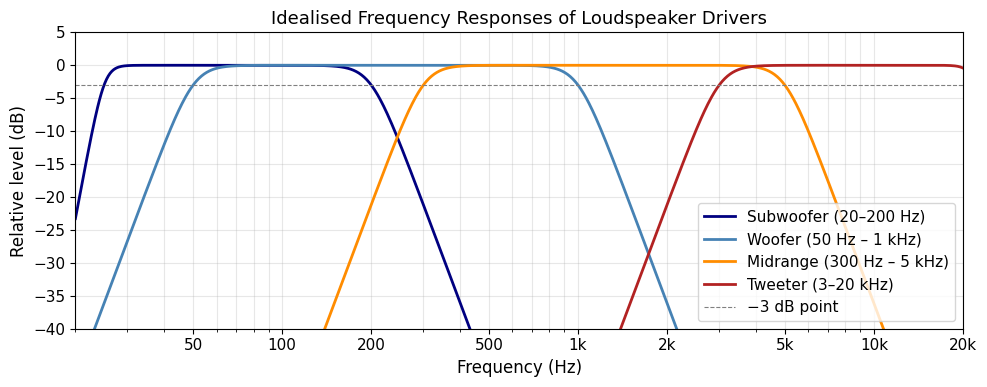
Loudspeaker placement and room interaction
A loudspeaker does not operate in isolation, it interacts strongly with the room in which it is placed. Reflections from walls, floor, and ceiling combine with the direct sound at the listener’s ears, modifying the perceived frequency response and spatial character.
- Bass is position-dependent. Room modes (see acoustics) make low frequencies loud in some spots and almost absent in others. Some people believe that a subwoofer can be placed anywhere. That is not true; you can easily test this by moving a subwoofer around in a room. Try to place it in a corner, then 1 meter from a wall and in the middle of the room. This will change the experienced bass sound more than any equaliser will.
- Walls add bass. A speaker close to a wall radiates more low end, because the reflection reinforces the direct sound; a corner adds more still. This is boundary loading, and it is why the same speaker sounds different once you move it.
- Stereo wants symmetry. When setting up two speakers in a stereo setup, the usual starting point is an equilateral triangle: you at one corner, the two speakers at the others tilted towards you so that the tweeters are at ear height and away from walls.
These effects mean that the same loudspeaker can sound quite different in different rooms, and that acoustic treatment of the room and careful speaker placement are as important as the choice of loudspeaker itself.
Amplifiers
An amplifier is a device that increases the power, voltage, or current of an electrical signal. In an audio signal chain, amplification is necessary because microphones produce very small voltages (millivolts) while loudspeakers require much larger voltages and currents to produce audible sound.
Signal levels
Audio signals travel at very different strengths at various points in the signal chain, and equipment expects a particular one at each input. From weakest to strongest: microphone level (needs a preamplifier before anything else can use it), instrument level (electric guitars and basses, usually via a DI box), line level (the standard for mixers, interfaces, and effects), and speaker level (the amplified signal driving a passive loudspeaker). Plugging a signal into an input expecting a different level is the single most common cause of a recording that is either buried in noise or badly distorted.
Preamplifiers
A preamplifier (preamp) amplifies a microphone-level signal to line level. A high-quality microphone preamplifier is essential for maintaining a low noise floor. If the preamp introduces noise, subsequent amplification will amplify that noise along with the signal. The key specification of a microphone preamplifier is its equivalent input noise (EIN), typically measured in dBu.
Dig deeper: nominal levels in dBu
- Microphone level (−60 to −40 dBu): the output of a microphone before amplification. Very small voltages; requires a preamplifier (preamp) to boost to line level.
- Instrument level (−20 to −10 dBu): the output of electric guitars, basses, and some keyboards. Higher than microphone level but typically unbalanced; requires a DI (direct injection) box or instrument input.
- Line level (0 dBu for professional, −10 dBV for consumer): the standard operating level for studio and consumer equipment such as mixers, effects processors, and CD players.
- Speaker level (many volts): the amplified signal driving a passive loudspeaker.
Many modern audio interfaces for recording contain built-in microphone preamplifiers. Professional recording studios may use high-quality external preamps (e.g., API 312, Neve 1073) that contribute to the characteristic sound of recordings made in those facilities.
Power amplifiers
A power amplifier takes a line-level signal and amplifies it to the voltages and currents needed to drive a loudspeaker. Power amplifiers are characterised by their output power (in watts) and their efficiency. Modern Class D amplifiers (switching amplifiers) are efficient enough (>80%) to run on batteries without much heat.
Phantom power
Most condenser microphones require an external power source to maintain the charge on the capacitor element. Phantom power (standardised at 48 V DC, denoted +48V) is supplied through the microphone cable by the preamplifier or audio interface. It is called ‘phantom’ because it does not interfere with the audio signal, which travels as a differential (balanced) pair on the same conductors. Dynamic and ribbon microphones generally do not require phantom power (and some older ribbon microphones can be damaged by it).
The signal chain
The signal chain is the complete path an audio signal follows from its acoustic source to the listener’s ears. Knowing the chain helps you troubleshoot problems and make sensible decisions about equipment and configuration.
A typical recording signal chain involves the following stages, here split into the capture half (from sound to computer) and the playback half (from computer to listener):
In live sound, the chain is similar but may include a digital mixing console and distribution to multiple loudspeakers covering different zones of the environment.
Balanced and unbalanced connections
Professional audio equipment uses balanced connections (throuh XLR or TRS connectors) to carry signals over long cable runs without picking up interference. A balanced connection carries the audio signal twice: once as a normal-polarity signal and once with the polarity inverted. Any electromagnetic interference picked up along the cable affects both conductors equally; at the receiving end, the differential input of the preamplifier or interface cancels the common-mode noise, leaving only the audio signal.
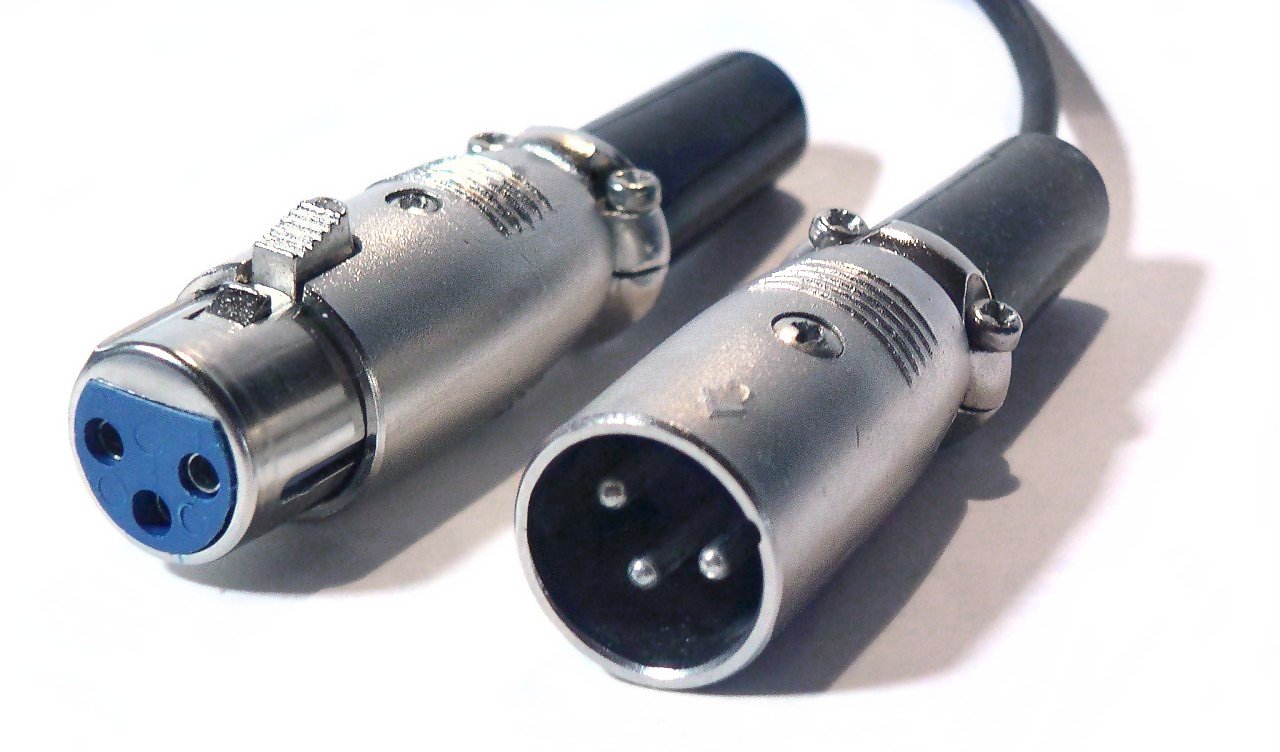
Figure: XLR connectors used for balanced audio connections (photo: Matti Blume, CC BY-SA 4.0).
Consumer and instrument-level connections are often unbalanced (TS connectors, RCA connectors), which are more susceptible to interference over long cable runs.
Gain staging
Gain staging is the practice of setting appropriate signal levels at each stage of the signal chain to maximise signal-to-noise ratio while avoiding clipping (distortion from exceeding the maximum signal level). Each stage should receive a signal that is neither so weak that noise becomes significant, nor so strong that it clips. In digital audio systems, clipping above 0 dBFS (decibels relative to full scale) causes severe digital distortion.
Signal processing
Signal processing is the field concerned with analysing, modifying, and synthesising signals such as sound, images, and scientific measurements. In electroacoustics and audio engineering, it is how we improve sound quality, pull out information, and adapt audio for specific uses.
Signal processing can happen in both the analogue and the digital domain. The important thing to remember is that everything you hear through a loudspeaker is processed, either manually or (increasingly) automatically: filtering and equalisation shape the tone, compression evens out the dynamics, and reverberation and other effects place the sound in a real or imagined space. The same operations run in a guitar pedal, a mixing console, a phone, and a hearing aid.
Dig deeper: main uses of signal processing in audio
- Amplification: increasing the strength of electrical signals so they can drive loudspeakers or be recorded at usable levels.
- Filtering: removing unwanted frequencies (such as noise or hum) or enhancing desired frequency ranges. Filters can be low-pass, high-pass, band-pass, or notch filters.
- Equalisation (EQ): adjusting the balance between frequency components to shape the tonal quality of audio signals.
- Dynamic range compression: reducing the difference between the loudest and quietest parts of a signal to make audio more consistent and prevent distortion.
- Noise reduction: techniques such as gating, spectral subtraction, or adaptive filtering to minimise background noise.
- Effects processing: adding reverberation, delay, chorus, distortion, or other effects to enhance or creatively alter the sound.
- Modulation: changing aspects of the signal such as amplitude, frequency, or phase for transmission or synthesis.
Synthesising sound
So far the signal chain has started from an acoustic source, a voice or an instrument that a microphone captures. A synthesiser turns this around and creates the electrical signal from scratch, with no acoustic source at all Russ, 2009. Nothing vibrates until the loudspeaker at the end of the chain, which is where the sound first becomes acoustic. Synthesisers are everywhere in popular music, from the basslines of 1980s synth-pop to the pads and leads of current chart productions.
Oscillators
The classic recipe is subtractive synthesis, which starts with an oscillator: a circuit or algorithm that produces a repeating waveform at a chosen frequency. Four waveforms dominate, and each has its own spectrum and therefore its own timbre. A sine wave contains only its fundamental and sounds pure, like the deep sub-bass under much hip-hop. The triangle wave adds weak odd harmonics and sounds soft and flute-like. The square wave has strong odd harmonics and a hollow, reedy character familiar from chiptune game music. The sawtooth wave contains every harmonic and sounds bright and buzzy, which makes it the usual starting point for rich lead and string sounds.
Source
import numpy as np
from scipy import signal
import matplotlib.pyplot as plt
plt.rcParams.update({
    "font.size": 10,
    "axes.titlesize": 11,
    "axes.labelsize": 10,
    "xtick.labelsize": 9,
    "ytick.labelsize": 9,
    "legend.fontsize": 9,
    "figure.figsize": (10, 4),
    "figure.dpi": 100,
    "savefig.dpi": 150,
    "axes.spines.top": False,
    "axes.spines.right": False,
})

f0 = 220            # fundamental frequency (Hz)
sr = 44100
t = np.linspace(0, 3 / f0, int(sr * 3 / f0), endpoint=False)  # three cycles

waves = {
    'Sine':     np.sin(2 * np.pi * f0 * t),
    'Triangle': signal.sawtooth(2 * np.pi * f0 * t, width=0.5),
    'Square':   signal.square(2 * np.pi * f0 * t),
    'Sawtooth': signal.sawtooth(2 * np.pi * f0 * t),
}

# Relative harmonic amplitudes (idealised Fourier series, in dB re fundamental)
n = np.arange(1, 16)
spectra = {
    'Sine':     np.where(n == 1, 1.0, 0.0),
    'Triangle': np.where(n % 2 == 1, 1.0 / n**2, 0.0),
    'Square':   np.where(n % 2 == 1, 1.0 / n, 0.0),
    'Sawtooth': 1.0 / n,
}

fig, axes = plt.subplots(2, 4, figsize=(10, 3.8))
colors = ['steelblue', 'seagreen', 'firebrick', 'darkorange']

for col, (name, color) in enumerate(zip(waves, colors)):
    ax = axes[0, col]
    ax.plot(t * 1000, waves[name], color=color, linewidth=1.5)
    ax.set_title(name)
    ax.set_ylim(-1.2, 1.2)
    ax.set_yticks([])
    ax.set_xlabel('Time (ms)')

    ax = axes[1, col]
    amps = spectra[name]
    present = amps > 0
    ax.vlines(n[present] * f0, -40, 20 * np.log10(amps[present]),
              color=color, linewidth=2)
    ax.set_ylim(-40, 3)
    ax.set_xlim(0, 15.5 * f0)
    ax.set_xlabel('Frequency (Hz)')
    if col == 0:
        ax.set_ylabel('Level (dB)')

axes[0, 0].set_ylabel('Amplitude')
plt.suptitle('The four classic oscillator waveforms and their harmonic spectra')
plt.tight_layout()
plt.show()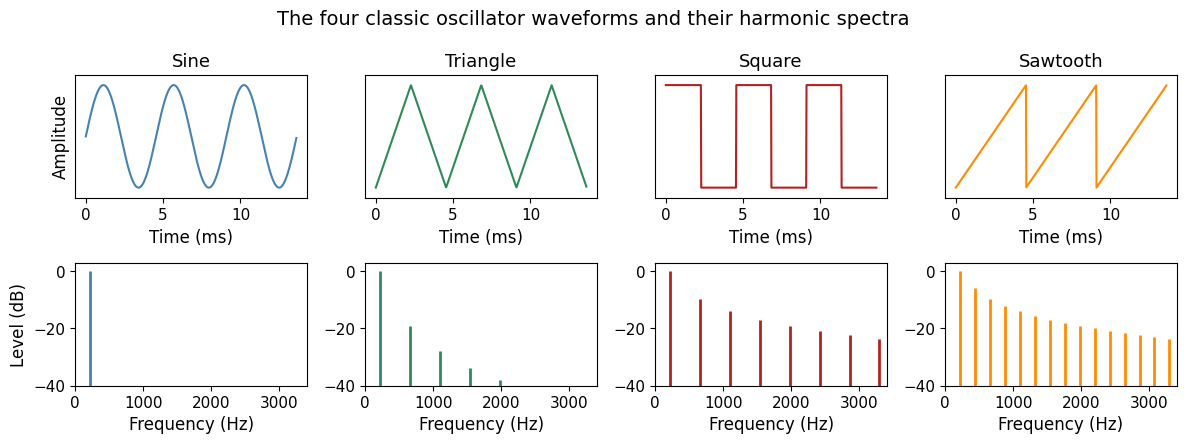
Source
import numpy as np
from scipy import signal
from IPython.display import Audio, display

sr = 44100
f0 = 220
dur = 1.2
t = np.linspace(0, dur, int(sr * dur), endpoint=False)

waves = {
    'Sine':     np.sin(2 * np.pi * f0 * t),
    'Triangle': signal.sawtooth(2 * np.pi * f0 * t, width=0.5),
    'Square':   signal.square(2 * np.pi * f0 * t),
    'Sawtooth': signal.sawtooth(2 * np.pi * f0 * t),
}

fade = np.minimum(1, np.minimum(t / 0.02, (dur - t) / 0.02))  # avoid clicks

for name, x in waves.items():
    print(f"{name} wave at {f0} Hz:")
    display(Audio(0.3 * x * fade, rate=sr))
Sine wave at 220 Hz:
Triangle wave at 220 Hz:
Square wave at 220 Hz:
Sawtooth wave at 220 Hz:
Filters and envelopes
The oscillator’s raw output is then shaped by a filter, a circuit or algorithm that weakens some parts of the spectrum, which is why the method is called subtractive. The most common type is the low-pass filter, which lets frequencies below a chosen cutoff frequency pass and dampens everything above it. Closing the cutoff makes a buzzy sawtooth progressively darker and rounder, and sweeping it while a note sounds produces the classic filter sweep heard across dance music. Many filters also offer resonance, a boost of the frequencies just around the cutoff, which at high settings gives the squelchy character of acid house basslines. The figure below shows the frequency response of the four basic types: a low-pass filter (with and without resonance), a high-pass, a band-pass, and a band-stop filter, all set to 1 kHz.
Source
import numpy as np
from scipy import signal
import matplotlib.pyplot as plt
plt.rcParams.update({
    "font.size": 10,
    "axes.titlesize": 11,
    "axes.labelsize": 10,
    "xtick.labelsize": 9,
    "ytick.labelsize": 9,
    "legend.fontsize": 9,
    "figure.figsize": (10, 4),
    "figure.dpi": 100,
    "savefig.dpi": 150,
    "axes.spines.top": False,
    "axes.spines.right": False,
})

freq = np.logspace(np.log10(20), np.log10(20000), 2000)
w = 2 * np.pi * freq
fc = 1000                       # cutoff / centre frequency (Hz)
wc = 2 * np.pi * fc

def response(b, a):
    _, h = signal.freqs(b, a, worN=w)
    return 20 * np.log10(np.abs(h) + 1e-12)

# Second-order analogue prototypes (12 dB per octave)
lowpass   = response(*signal.butter(2, wc, 'lowpass',  analog=True))
highpass  = response(*signal.butter(2, wc, 'highpass', analog=True))
bandpass  = response(*signal.butter(1, [wc / 1.5, wc * 1.5], 'bandpass', analog=True))
bandstop  = response(*signal.butter(1, [wc / 1.5, wc * 1.5], 'bandstop', analog=True))
resonant  = response([wc**2], [1, wc / 5, wc**2])   # low-pass with Q = 5

panels = [
    ('Low-pass',  lowpass,  'steelblue'),
    ('High-pass', highpass, 'darkorange'),
    ('Band-pass', bandpass, 'seagreen'),
    ('Band-stop', bandstop, 'firebrick'),
]

fig, axes = plt.subplots(1, 4, figsize=(10, 3.0), sharey=True)
for ax, (name, curve, color) in zip(axes, panels):
    ax.semilogx(freq, curve, color=color, linewidth=2, label=name)
    if name == 'Low-pass':
        ax.semilogx(freq, resonant, color=color, linewidth=1.5, linestyle='--',
                    label='with resonance')
        ax.legend(loc='lower left')
    ax.axvline(fc, color='grey', linestyle=':', linewidth=1)
    ax.axhline(-3, color='grey', linestyle='--', linewidth=0.8)
    ax.set_title(name)
    ax.set_xlim(20, 20000)
    ax.set_ylim(-40, 15)
    ax.set_xticks([100, 1000, 10000])
    ax.set_xticklabels(['100', '1k', '10k'])
    ax.set_xlabel('Frequency (Hz)')
    ax.grid(True, which='both', alpha=0.3)

axes[0].set_ylabel('Level (dB)')
axes[1].text(fc * 1.15, -37, 'cutoff', color='grey')
plt.suptitle('The four basic filter types (cutoff or centre frequency 1 kHz, −3 dB line dashed)')
plt.tight_layout()
plt.show()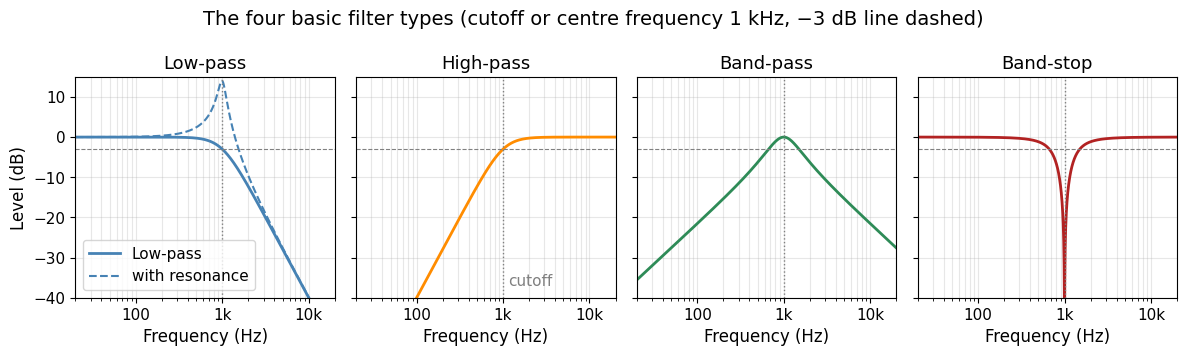
An envelope then shapes how the level of each note unfolds over time. The standard version is the ADSR envelope, with four stages. Attack sets how quickly the sound reaches full level, decay how quickly it falls back, sustain the level held while the key stays down, and release how long the sound lingers after the key is lifted. A fast attack and short decay give a plucked, percussive note, while a slow attack and long release give a soft pad that swells and lingers. Envelopes can also steer the filter cutoff, so that each note opens brightly and then mellows. The figure below shows four typical envelope shapes and the tones they produce.
Source
import numpy as np
import matplotlib.pyplot as plt
plt.rcParams.update({
    "font.size": 10,
    "axes.titlesize": 11,
    "axes.labelsize": 10,
    "xtick.labelsize": 9,
    "ytick.labelsize": 9,
    "legend.fontsize": 9,
    "figure.figsize": (10, 4),
    "figure.dpi": 100,
    "savefig.dpi": 150,
    "axes.spines.top": False,
    "axes.spines.right": False,
})

sr = 4000                                  # coarse rate: enough to draw the shapes
def adsr(attack, decay, sustain, release, hold, sr=sr):
    """ADSR envelope; `hold` is how long the key stays down (s)."""
    a = np.linspace(0, 1, int(attack * sr), endpoint=False)
    d = np.linspace(1, sustain, int(decay * sr), endpoint=False)
    s_len = max(0, int(hold * sr) - len(a) - len(d))
    s = np.full(s_len, sustain)
    r = np.linspace(sustain, 0, int(release * sr))
    env = np.concatenate([a, d, s, r])
    return np.arange(len(env)) / sr, env

hold = 1.5                                  # key held for 1.5 s in every panel
shapes = {
    'Plucked':  dict(attack=0.005, decay=0.35, sustain=0.15, release=0.25),
    'Organ':    dict(attack=0.01,  decay=0.0,  sustain=1.0,  release=0.03),
    'Brass':    dict(attack=0.12,  decay=0.25, sustain=0.75, release=0.30),
    'Pad':      dict(attack=0.8,   decay=0.4,  sustain=0.6,  release=1.2),
}

fig, axes = plt.subplots(2, 2, figsize=(10, 6.2), sharey=True)
axes = axes.ravel()
for k, (ax, (name, p)) in enumerate(zip(axes, shapes.items())):
    t, env = adsr(hold=hold, **p)
    tone = env * np.sin(2 * np.pi * 40 * t)  # slow tone so the waveform is visible
    ax.plot(t, tone, color='0.8', linewidth=0.6)
    ax.plot(t, env, color='steelblue', linewidth=2)
    ax.axvline(hold, color='grey', linestyle=':', linewidth=1)
    ax.text(hold, 1.13, 'key up', color='grey', ha='center')
    ax.text(0, 1.13, 'key down', color='grey', ha='left')
    # Stage labels at the middle of each stage
    a, d, s, r = p['attack'], p['decay'], p['sustain'], p['release']
    labels = [('A', a / 2), ('D', a + d / 2), ('S', a + d + (hold - a - d) / 2), ('R', hold + r / 2)]
    for letter, x in labels:
        if letter == 'D' and d == 0:
            continue
        ax.text(x, -0.9, letter, ha='center', color='steelblue', fontweight='bold')
    ax.set_title(name, pad=16)
    ax.text(0.5, 1.02, f"A {a*1000:.0f} · D {d*1000:.0f} · S {s:.0%} · R {r*1000:.0f} ms",
            transform=ax.transAxes, ha='center', color='0.35')
    ax.set_xlim(-0.05, 3.0)
    ax.set_ylim(-1.05, 1.25)
    if k >= 2:
        ax.set_xlabel('Time (s)')
    if k % 2 == 0:
        ax.set_ylabel('Amplitude')
    ax.grid(alpha=0.3)

plt.suptitle('ADSR envelopes for four common sound types (envelope in blue, shaped tone in grey)')
plt.tight_layout()
plt.show()
Additive and FM synthesis
Additive synthesis works in the opposite direction: instead of carving away at a rich waveform, it builds timbre by adding sine-wave partials one by one. This is exactly the idea behind the harmonics demo in the acoustics chapter, where sine waves summed into a complex tone. The drawbars of a Hammond organ are an early mechanical version, with each drawbar adding one harmonic to the mix. Below, a 220 Hz tone is built from one, two, four, and eight harmonic partials, each with amplitude 1/n, so that the sum approaches a sawtooth. Listen to how every added partial brightens the sound.
Source
import numpy as np
import matplotlib.pyplot as plt
plt.rcParams.update({
    "font.size": 10,
    "axes.titlesize": 11,
    "axes.labelsize": 10,
    "xtick.labelsize": 9,
    "ytick.labelsize": 9,
    "legend.fontsize": 9,
    "figure.figsize": (10, 4),
    "figure.dpi": 100,
    "savefig.dpi": 150,
    "axes.spines.top": False,
    "axes.spines.right": False,
})

f0 = 220
sr = 44100
t = np.linspace(0, 3 / f0, int(sr * 3 / f0), endpoint=False)   # three cycles
counts = [1, 2, 4, 8]
colors = ['steelblue', 'seagreen', 'darkorange', 'firebrick']

fig, axes = plt.subplots(2, 4, figsize=(10, 3.8))
for col, (n_partials, color) in enumerate(zip(counts, colors)):
    n = np.arange(1, n_partials + 1)
    amps = 1.0 / n                                  # sawtooth-like recipe
    wave = sum(a * np.sin(2 * np.pi * k * f0 * t) for k, a in zip(n, amps))
    wave /= np.abs(wave).max()

    ax = axes[0, col]
    ax.plot(t * 1000, wave, color=color, linewidth=1.5)
    ax.set_title(f'{n_partials} partial{"s" if n_partials > 1 else ""}')
    ax.set_ylim(-1.2, 1.2)
    ax.set_yticks([])
    ax.set_xlabel('Time (ms)')

    ax = axes[1, col]
    ax.vlines(n * f0, -40, 20 * np.log10(amps), color=color, linewidth=2)
    ax.set_ylim(-40, 3)
    ax.set_xlim(0, 9 * f0)
    ax.set_xlabel('Frequency (Hz)')
    if col == 0:
        ax.set_ylabel('Level (dB)')

axes[0, 0].set_ylabel('Amplitude')
plt.suptitle('Additive synthesis: summing harmonic partials (each at 1/n) builds towards a sawtooth')
plt.tight_layout()
plt.show()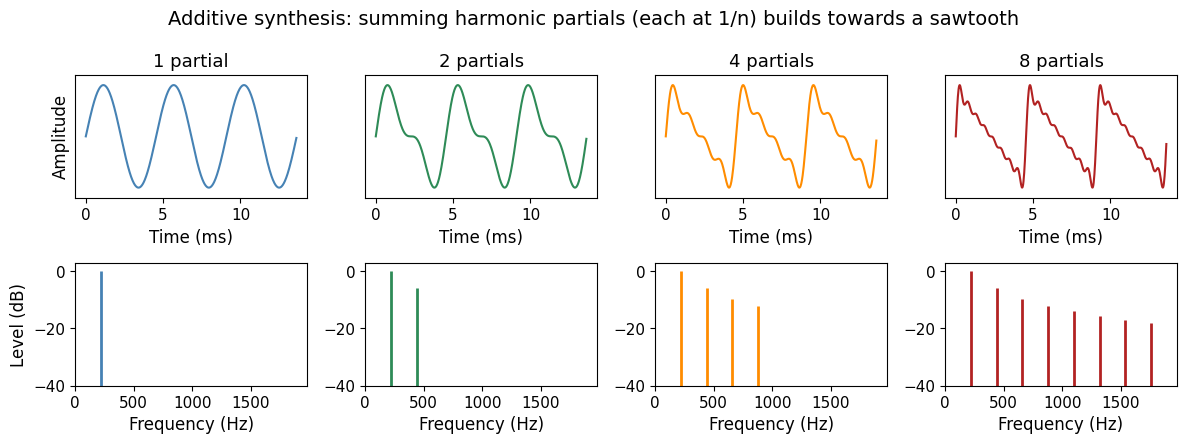
Source
import numpy as np
from IPython.display import Audio, display

sr = 44100
f0 = 220
dur = 1.2
t = np.linspace(0, dur, int(sr * dur), endpoint=False)
fade = np.minimum(1, np.minimum(t / 0.02, (dur - t) / 0.02))  # avoid clicks

for n_partials in [1, 2, 4, 8, 16]:
    n = np.arange(1, n_partials + 1)
    x = sum(np.sin(2 * np.pi * k * f0 * t) / k for k in n)
    x /= np.abs(x).max()
    print(f"{n_partials} partial{'s' if n_partials > 1 else ''} at {f0} Hz:")
    display(Audio(0.3 * x * fade, rate=sr))
1 partial at 220 Hz:
2 partials at 220 Hz:
4 partials at 220 Hz:
8 partials at 220 Hz:
16 partials at 220 Hz:
Frequency modulation (FM) synthesis instead uses one oscillator to wobble the frequency of another at audio rate, which spreads energy into dense clusters of partials at very little computational cost. The method powered the Yamaha DX7, whose glassy electric pianos and bell-like tones define countless 1980s pop ballads. Bells and metallic sounds suit FM particularly well because their partials do not follow the neat harmonic series of strings and pipes. The figure and sounds below keep both the carrier and the modulator at 220 Hz and raise the modulation index, the depth of the wobble; the spectrum stays harmonic but gains more partials as the index grows. The last sound detunes the modulator to a ratio of 1:1.4 and lets the index decay with the note, which gives an inharmonic, bell-like tone.
Source
import numpy as np
import matplotlib.pyplot as plt
plt.rcParams.update({
    "font.size": 10,
    "axes.titlesize": 11,
    "axes.labelsize": 10,
    "xtick.labelsize": 9,
    "ytick.labelsize": 9,
    "legend.fontsize": 9,
    "figure.figsize": (10, 4),
    "figure.dpi": 100,
    "savefig.dpi": 150,
    "axes.spines.top": False,
    "axes.spines.right": False,
})

sr = 44100
fc = 220                     # carrier frequency (Hz)
fm = 220                     # modulator frequency (Hz), ratio 1:1 gives a harmonic spectrum
indices = [0, 1, 3, 6]       # modulation index I
colors = ['steelblue', 'seagreen', 'darkorange', 'firebrick']

dur = 0.5
t = np.linspace(0, dur, int(sr * dur), endpoint=False)
cycles = t < 3 / fc          # three cycles for the waveform plots
window = np.hanning(len(t))
freqs = np.fft.rfftfreq(len(t), 1 / sr)

fig, axes = plt.subplots(2, 4, figsize=(10, 3.8))
for col, (I, color) in enumerate(zip(indices, colors)):
    y = np.sin(2 * np.pi * fc * t + I * np.sin(2 * np.pi * fm * t))

    ax = axes[0, col]
    ax.plot(t[cycles] * 1000, y[cycles], color=color, linewidth=1.5)
    ax.set_title(f'Modulation index I = {I}')
    ax.set_ylim(-1.2, 1.2)
    ax.set_yticks([])
    ax.set_xlabel('Time (ms)')

    ax = axes[1, col]
    spec = np.abs(np.fft.rfft(y * window))
    spec = 20 * np.log10(spec / spec.max() + 1e-6)
    ax.plot(freqs, spec, color=color, linewidth=1.2)
    ax.set_ylim(-40, 3)
    ax.set_xlim(0, 12 * fc)
    ax.set_xlabel('Frequency (Hz)')
    if col == 0:
        ax.set_ylabel('Level (dB)')

axes[0, 0].set_ylabel('Amplitude')
plt.suptitle(f'FM synthesis: a {fc} Hz carrier modulated at {fm} Hz; raising the index spreads energy into more partials')
plt.tight_layout()
plt.show()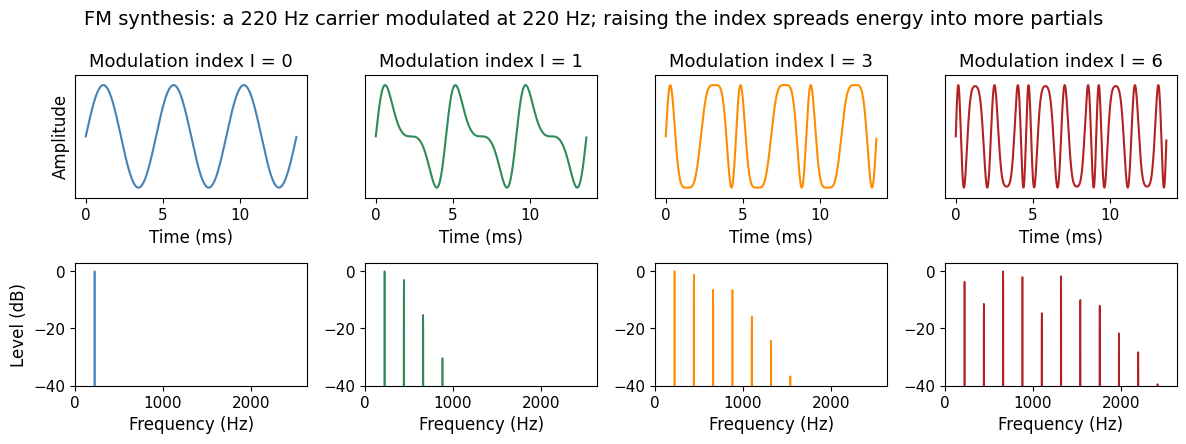
Source
import numpy as np
from IPython.display import Audio, display

sr = 44100
fc = 220
dur = 1.2
t = np.linspace(0, dur, int(sr * dur), endpoint=False)
fade = np.minimum(1, np.minimum(t / 0.02, (dur - t) / 0.02))  # avoid clicks

def fm_tone(fc, fm, index):
    return np.sin(2 * np.pi * fc * t + index * np.sin(2 * np.pi * fm * t))

for I in [0, 1, 3, 6]:
    print(f"Carrier {fc} Hz, modulator {fc} Hz (ratio 1:1), index I = {I}:")
    display(Audio(0.3 * fm_tone(fc, fc, I) * fade, rate=sr))

# A bell: inharmonic ratio and an index that decays with the note
env = np.exp(-2.5 * t)
bell = np.sin(2 * np.pi * fc * t + 5 * env * np.sin(2 * np.pi * fc * 1.4 * t))
print(f"Bell: carrier {fc} Hz, modulator {fc * 1.4:.0f} Hz (ratio 1:1.4), index decaying from 5:")
display(Audio(0.3 * bell * env * fade, rate=sr))
Carrier 220 Hz, modulator 220 Hz (ratio 1:1), index I = 0:
Carrier 220 Hz, modulator 220 Hz (ratio 1:1), index I = 1:
Carrier 220 Hz, modulator 220 Hz (ratio 1:1), index I = 3:
Carrier 220 Hz, modulator 220 Hz (ratio 1:1), index I = 6:
Bell: carrier 220 Hz, modulator 308 Hz (ratio 1:1.4), index decaying from 5:
Sampling and granular synthesis
A sampler does not generate waveforms at all but plays back stored recordings, pitched up and down across the keyboard. Sampling grew out of the French school following Pierre Schaeffer and was later taken up in popular culture. Hip-hop is a genre where sampled drum breaks is a key element of the musical expression, and lots of film and TV scores lean on sampled orchestras with thousands of recorded notes per instrument. Sampling blurs the border between recording and instrument: any captured sound can become playable material.
Granular synthesis pushes that idea further by chopping a recording into tiny grains, each lasting only tens of milliseconds, and re-scattering them in new patterns. Because the grains can be repeated and overlapped freely, a sound can be stretched in time without changing its pitch, or frozen into a shimmering, sustained cloud. Ambient and electronic producers use granular tools to turn a single vocal syllable into an evolving texture.
Digital audio
Digital audio extends the electroacoustic signal chain into storage, editing, transmission, and reproduction on computers and digital devices.
Digitisation
Digitisation is the process of converting physical sound into a digital audio signal using an analogue-to-digital converter (ADC). It happens in two steps: sampling and quantisation.
First, the continuous sound wave is measured at regular intervals, producing a stream of samples. The number of measurements per second is the sampling rate. Next, each sampled value is rounded to the nearest value that can be represented by a fixed number of bits, the bit depth. The result is a stream of numbers that digital systems can store, process, and transmit.
The figure below shows both ideas at once. Each row lowers the sampling rate, so the samples (blue dots) get sparser in time; each column lowers the bit depth, so the samples snap to fewer amplitude levels. The grey wave is the original sound, and the blue steps are what the digital system actually stores.
Source
import numpy as np
import matplotlib.pyplot as plt
plt.rcParams.update({
    "font.size": 10,
    "axes.titlesize": 11,
    "axes.labelsize": 10,
    "xtick.labelsize": 9,
    "ytick.labelsize": 9,
    "legend.fontsize": 9,
    "figure.figsize": (10, 4),
    "figure.dpi": 100,
    "savefig.dpi": 150,
    "axes.spines.top": False,
    "axes.spines.right": False,
})

# A short "sound": a 500 Hz tone with a weaker 1500 Hz partial, 4 ms long
dur = 0.004
tt = np.linspace(0, dur, 4000)
def wave(t):
    return 0.7 * np.sin(2 * np.pi * 500 * t) + 0.3 * np.sin(2 * np.pi * 1500 * t)

def quantise(x, bits):
    levels = 2 ** bits
    step = 2 / levels
    return np.clip(np.round(x / step) * step, -1, 1 - step)

rates = [32000, 8000, 4000]     # rows: samples per second
depths = [16, 4, 2]             # columns: bits per sample

fig, axes = plt.subplots(3, 3, figsize=(10, 6.7), sharex=True, sharey=True)
for r, sr in enumerate(rates):
    ts = np.arange(0, dur, 1 / sr)
    for c, bits in enumerate(depths):
        ax = axes[r, c]
        ax.plot(tt * 1000, wave(tt), color='0.75', linewidth=1.2)
        xq = quantise(wave(ts), bits)
        if bits <= 4:  # draw the available amplitude levels
            for lv in np.arange(-1, 1, 2 / 2 ** bits):
                ax.axhline(lv, color='0.9', linewidth=0.6, zorder=0)
        ax.step(np.append(ts, dur) * 1000, np.append(xq, xq[-1]), where='post',
                color='steelblue', linewidth=1.3)
        ax.plot(ts * 1000, xq, 'o', color='steelblue', markersize=4)
        ax.set_ylim(-1.15, 1.15)
        ax.set_xlim(0, dur * 1000)
        ax.grid(alpha=0.2)
        if r == 0:
            ax.set_title(f'{bits}-bit ({2 ** bits:,} levels)')
        if c == 0:
            ax.set_ylabel(f'{sr // 1000} kHz\n({int(sr * dur)} samples in 4 ms)')
        if r == 2:
            ax.set_xlabel('Time (ms)')

fig.text(0.5, 0.945, 'Bit depth (amplitude resolution) →', ha='center', color='0.3')
fig.text(0.012, 0.5, '← Sampling rate (time resolution)', va='center', rotation='vertical', color='0.3')
plt.suptitle('Digitising a sound: the grey wave is the original, the blue steps are the stored samples', y=0.995)
plt.tight_layout(rect=(0.03, 0, 1, 0.96))
plt.show()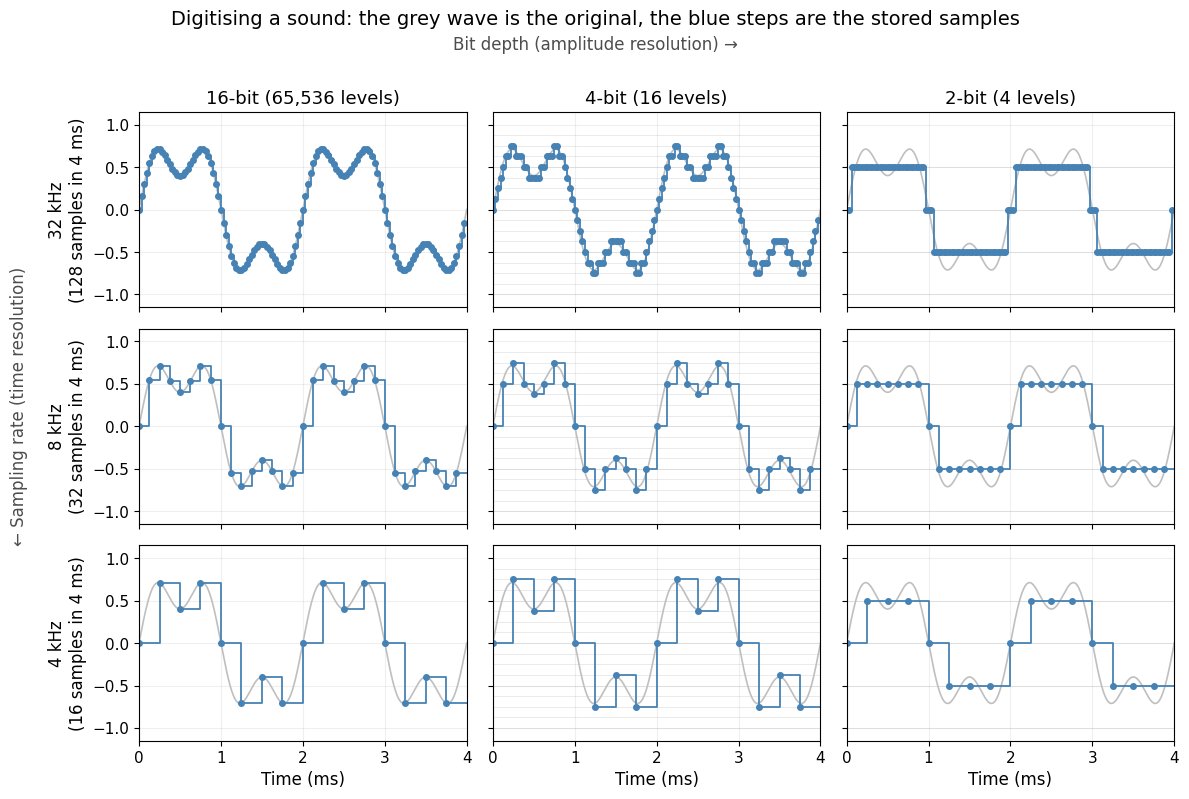
Sampling rate
The sampling rate is the number of samples per second taken from a continuous signal to create a discrete signal. According to the Nyquist–Shannon sampling theorem Shannon, 1949, the sampling rate must be at least twice the highest frequency present in the signal to reconstruct it accurately. This minimum limit is known as the Nyquist frequency. Since humans can hear frequencies up to around 20,000 Hz, this means that sound needs to be sampled at more than 40,000 Hz to capture all audible sound.
Dig deeper: why 44.1 kHz?
Digital audio has for a long time been standardised at using 44,100 Hz, which can represent frequencies up to 22,050 Hz. The oddly specific number is a piece of history dating back to the introduction of the CD. The rate had to be a little above twice the 20 kHz upper limit of hearing, to leave room for the anti-aliasing filter that removes everything above the Nyquist frequency before sampling. The exact value came from video. In the late 1970s the only recorders with enough bandwidth for digital audio were video tape machines, so early systems such as Sony’s PCM adaptors stored the audio samples as a pseudo-video picture, three samples per television line. 44,100 Hz is the rate that fits a whole number of samples into both television standards: 60 fields per second × 245 usable lines × 3 samples in NTSC, and 50 × 294 × 3 in PAL, both give 44,100. When Sony and Philips finalised the CD in 1980, the mastering recorders already ran at this rate, and it has stayed with us ever since. Professional recording often uses 48 kHz, 96 kHz, or higher. Higher sampling rates can reduce aliasing, where frequencies too high to be represented reappear as false lower tones (demonstrated below), and leave more headroom for some processing tasks, but they also increase file size and CPU load.
Bit depth
The audio bit depth is the amount of data used to represent each individual sample in a digital audio signal. Bit depth sets the precision of the stored amplitude values: higher bit depths give lower quantisation noise and a greater dynamic range. CDs use 16 bits per sample, professional recording usually 24, and modern recorders increasingly 32-bit floating point, whose enormous headroom means that even a badly set recording level can often be rescued afterwards. At normal listening levels the audible differences are small; what the extra bits buy is safety margin while recording and processing.
Dig deeper: common bit depths
- Low bit depth (for example 8-bit): few available amplitude levels, which can introduce audible distortion and noise.
- 16-bit: the CD standard, allowing 65,536 possible amplitude values.
- 24-bit: common in professional recording, offering over 16 million levels and much greater practical headroom.
- 32-bit float: used in some modern recorders and production workflows, providing extremely large headroom and flexibility during recording and post-production.
Digital audio interfaces
A digital audio interface connects microphones, instruments, and other audio sources to a computer for recording, and routes the computer’s audio output to loudspeakers or headphones for playback. All laptops and mobile phones have in-built audio interfaces, but for professional use, it is common to have an external device that you connect with a USB cable.
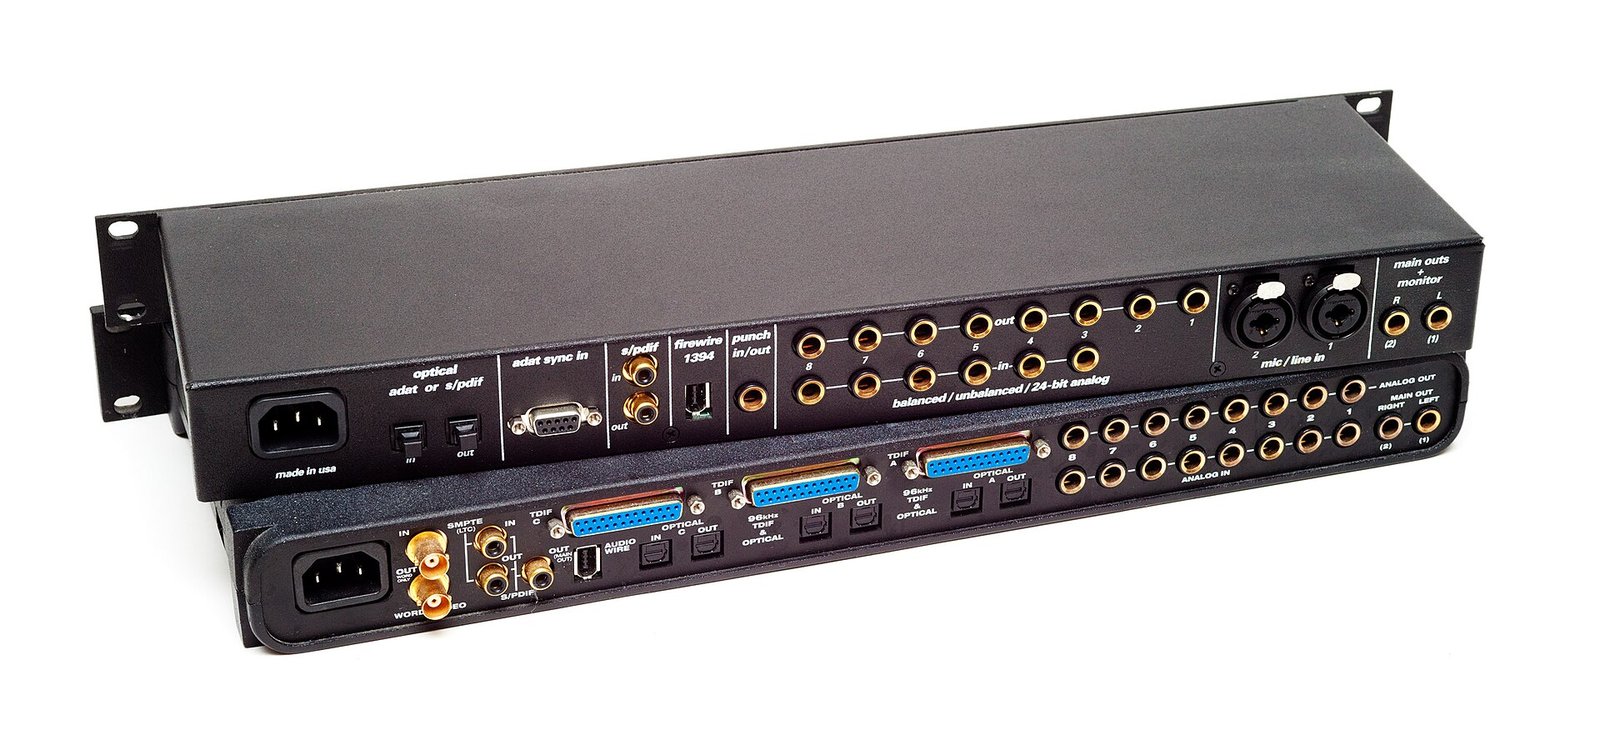
Figure: MOTU audio interfaces (photo: Wikimedia Commons).
Inside, an interface combines the pieces this chapter has introduced one by one: microphone preamplifiers, the analogue-to-digital and digital-to-analogue converters, and a headphone amplifier, connected to the computer over USB or another protocol.
The converters in an audio interface apply the principles of sampling and quantisation described above. The quality of the ADCs and DACs, together with the chosen sample rate and bit depth, affects the transparency, noise floor, and working headroom of a recording system.
Dig deeper: what an audio interface contains
- Microphone preamplifiers: one or more high-quality preamps to bring microphone-level signals up to line level.
- Analogue-to-digital converters (ADCs): convert the analogue input signal to a digital bitstream at the chosen sample rate and bit depth.
- Digital-to-analogue converters (DACs): convert the digital output from the computer back to an analogue signal for monitoring.
- Headphone amplifier: a low-impedance amplifier to drive headphones from the monitor output.
- Digital audio connectivity: USB, Thunderbolt, FireWire, or Dante connections to the computer.
Real-time audio, buffers, and latency
In a digital audio workstation (DAW), a live performance setup, or a real-time synthesis patch, audio is processed in blocks (buffers) of samples rather than as one infinite stream. The buffer size, together with the sampling rate, sets how often the computer must finish a round of processing. A smaller buffer means lower latency, the delay between input and output, but it leaves less time per block and raises CPU load. A larger buffer is more forgiving with heavy plug-ins, but it increases latency and can make timing feel sluggish when you monitor yourself or play virtual instruments.
Round-trip latency comes from several places: analogue-to-digital and digital-to-analogue conversion, buffering in the driver and the application, and the digital signal processing in the chain. Interfaces and drivers often report separate input and output figures, but what matters to a performer is the total monitoring delay. To avoid hearing themselves late, many systems offer direct monitoring, an analogue path from input to headphones that bypasses the computer.
At the University of Oslo, we have been researching network music performance for many years. This is based on the musicians being in different locations, which, by design, introduces latency. There are many technological challenges in making this work in practice. There are also many interesting psychological lessons to be learned from such experimentation. Finally, it can also lead to interesting musical results.
Video: An example of a networked music–dance performance at Popsenteret in 2024. Musicians and dancers performed live from different floors, connected through low-latency audio and multi-stream video technologies. The project explored how performers create a sense of togetherness, timing, and shared presence despite physical separation, transforming technological limitations such as latency into artistic material.
Audio compression and file formats
Digital audio also has to be stored and transmitted efficiently. Audio containers are file formats that hold digital audio data together with metadata such as track information, album art, and artist details. Common containers include WAV and AIFF, both of which typically store uncompressed, high-quality audio.
Some containers, such as MKV, can hold uncompressed or compressed audio alongside video and metadata. Others, such as MP4, often store compressed audio, frequently together with video.
The container and the compression method are two separate things. Audio file compression reduces the file size of digital audio to make storage and transmission more efficient, and it is not the same as the dynamic range compression used in mixing and mastering. There are two main types:
- Lossless compression: preserves all original audio data, allowing perfect reconstruction, as in FLAC and ALAC.
- Lossy compression: removes some audio data, usually components that are less perceptible to human hearing, to achieve smaller file sizes, as in MP3 and AAC.
| Format | Compression Type | Typical Use | Quality |
|---|---|---|---|
| WAV, AIFF | None | Recording, editing | Excellent |
| FLAC | Lossless | Archiving, hi-fi | Excellent |
| AAC | Lossy | Streaming | Good |
How does a lossy codec decide what to remove? This is where electroacoustics leans directly on psychoacoustics. A perceptual codec splits the signal into frequency bands and, moment by moment, runs a psychoacoustic model of what a human ear would actually notice. The key phenomenon is masking: a strong sound makes weaker sounds close to it in frequency (simultaneous masking) or in time (temporal masking) inaudible. Components the model predicts are masked can be stored very coarsely or discarded altogether, and the saved bits are spent where hearing is most sensitive.
This is why an MP3 file at a typical streaming bitrate keeps less than a tenth of the data in the CD-quality original, yet most listeners cannot tell the difference. Push the bitrate lower and the model must start discarding components that are not fully masked, which is when the familiar artefacts appear: a swirly, underwater quality, most audible in cymbals, reverb tails, and other noise-like sounds. Lossy compression is, in other words, applied psychoacoustics: a working monument to the fact that we do not hear everything that reaches our ears.
AAC generally gives better quality than MP3 at a similar file size, which is why it is commonly used for streaming. Open ecosystems also offer alternatives such as the Ogg container and related codecs.
Spatial audio
The ears locate a sound using three cues: the difference in arrival time between the ears, the difference in level, and the filtering the head and outer ear impose. How these cues work in perception is explained in the next chapter, psychoacoustics. Spatial audio is the engineering side of the same problem. Given loudspeakers or headphones, how do you deliver those cues convincingly?
Channel-based audio
The oldest and still the most common approach stores one signal per loudspeaker. Stereo is the familiar case. A source panned between two speakers is not really located anywhere: sending the same signal to both at equal level produces a phantom image, which the listener hears as coming from a point between the speakers even though nothing is radiating from there. Adjusting the balance slides the image left or right. Surround formats such as 5.1 extend the idea with more speakers, adding rear channels for ambience and a dedicated low-frequency channel.
Channel-based audio is simple and robust, but the mix is made for one specific loudspeaker layout, and the illusion is only reliable in the sweet spot, the small region roughly equidistant from the speakers. If you move off-centre, the phantom images collapse towards whichever speaker you are nearest.
Binaural audio
If the spatial cues are things that happen at the two eardrums, then delivering them over headphones is a matter of reproducing the right signal at each ear. That is what binaural audio does, either by recording with microphones in the ears of a dummy head, or by filtering a mono source with a head-related transfer function (HRTF) for the desired direction: the measured filtering that the head and outer ears apply to sound arriving from that direction.
Binaural audio can be convincing, but it has two well-known problems. HRTFs are individual, since they depend on the shape of your head, torso, and outer ears, so a generic HRTF localises less well for most listeners, but not all. Also, a static binaural rendering turns with your head, which the real world does not do. That is why many virtual reality (VR) systems use head trackers to rotate the auditory scene to compensate.
Scene-based audio and ambisonics
The third approach stores neither speakers nor ears, but a description of the sound field itself, which is then decoded to whatever the playback system happens to be. Ambisonics is the main example: a full-sphere surround technique whose first-order recordings carry four channels, together known as B-format, that capture both the overall sound pressure at a point and which direction the sound is coming from. Higher orders add further channels, sharpening the spatial resolution at the cost of more of them.
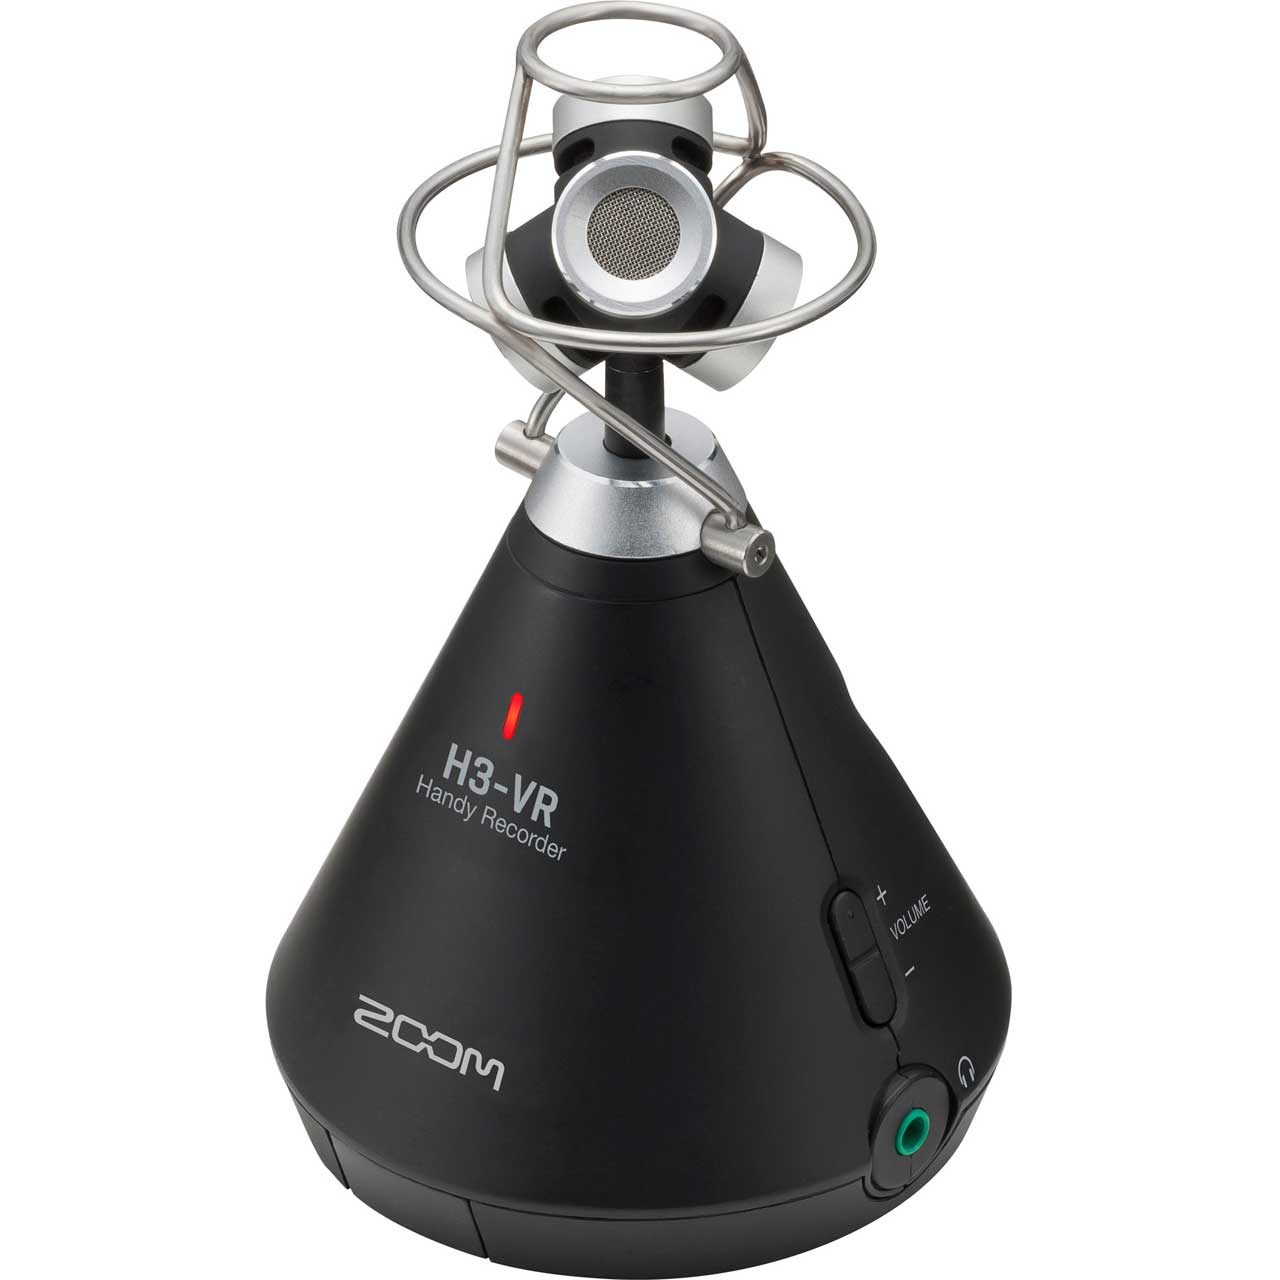
Figure: The Zoom H3-VR is an affordable Ambisonics recorder that we are using for many projects at UiO.
The practical appeal is that recording and reproduction are decoupled. One ambisonic recording can be decoded to a pair of headphones, to a stereo pair, or to a dome of thirty speakers, and it can be rotated before decoding, which is what makes it the usual carrier format for virtual reality and 360-degree video. Because such a recording stores direction as well as level, it can also be analysed to reveal where sound comes from and how diffuse it is; machine listening puts this to use for describing everyday sound environments.
Object-based audio
A fourth approach, common in cinema, stores each source as a mono signal plus metadata saying where it should be, and leaves the renderer in the playback room to work out which speakers to use. This is object-based audio, and it is best understood as deferring the panning decision from the mixing stage to the listening stage. Dolby Atmos is the best-known example. It began in cinemas in 2012, where a mix of up to 128 objects is rendered to whatever speaker array the theatre has, including overhead speakers for height. Since the early 2020s it has also become a delivery format for music: streaming services offer Atmos mixes of albums, and on headphones these are rendered binaurally, so most listeners meet object-based audio as a form of binaural playback.
Atmos and ambisonics are easy to confuse, since both promise independence from the playback layout, but they store different things. An ambisonic recording describes the sound field at one point, sources and room together, and the decoder derives speaker or headphone feeds from that description; it can be captured directly with a microphone and rotated as a whole. Atmos stores individual sources, each a mono signal with metadata about where it should be, and the renderer places them on whatever speakers exist. That makes it a production format rather than a recording format: objects are authored in a mix, and a room cannot be recorded into Atmos the way it can with an ambisonic microphone. In practice the two often meet, as when a game or VR engine carries the ambience as ambisonics and the characters as objects, and both end up rendered binaurally on headphones.
Electroacoustic systems in practice
Studio recording
A professional recording studio provides a controlled acoustic environment with carefully treated rooms, high-quality microphones, preamplifiers, and monitoring loudspeakers. The most consequential decision is often simply distance. Close-miking (within about 30 cm) minimises room reflections and gives the dry, present sound of most pop and rock production, though directional microphones then add extra bass through the proximity effect. Room miking (one to five metres away) captures the space along with the instrument, which is part of why orchestral recordings sound like they happen somewhere. Stereo images are captured with pairs of microphones in standardised arrangements.
Going deeper: stereo microphone techniques
- XY (coincident pair): two cardioid microphones angled at 90–135°, with their capsules at the same point. Mono-compatible.
- ORTF: two cardioid microphones spaced 17 cm apart and angled at 110°, mimicking the spacing and angle of human ears.
- A/B (spaced pair): two omnidirectional microphones spaced 0.5–3 m apart. Wide stereo image but phase issues can affect mono compatibility.
- Mid-Side (M-S): a cardioid microphone (mid) combined with a figure-8 microphone (side), with the side signal added to and subtracted from the mid signal to create left and right channels. The stereo width is adjustable after recording.
Live sound reinforcement
In live sound, the goal is to amplify performers so that the entire audience can hear clearly without the system causing feedback or colouring the sound. Key considerations include:
- Feedback: occurs when the microphone picks up sound from the loudspeaker, which is re-amplified, creating a loop. Controlling feedback requires careful choice of polar patterns, microphone placement relative to speakers, and equalisation.
- Monitor speakers (wedges/in-ear monitors): on-stage speakers facing the performers, allowing them to hear themselves and the rest of the ensemble.
- Line arrays: the vertical columns of speakers hanging beside the stage at large concerts. Stacking elements this way narrows the vertical coverage, so the sound can be aimed at the audience rather than at the ceiling, which is what makes even coverage of an arena possible without drowning the stage in reflections.
Measurement microphones
Electroacoustic measurement uses specialised measurement microphones (typically small-diaphragm condensers with precisely flat, omnidirectional response) to characterise rooms, loudspeakers, and other acoustic systems. Room correction software (such as Dirac Live or Sonarworks) uses measurement microphone recordings to create correction filters that flatten the in-room frequency response of a loudspeaker system at the listening position.
A critical look: can you hear high-resolution audio?
Streaming services sell tiers of sound quality, and hi-fi magazines have argued for decades that 24-bit audio at 96 or 192 kHz sounds audibly better than the 16-bit, 44.1 kHz standard of the CD. The chapter has explained what those numbers mean, which makes this a good claim to test against listening experiments.
- The claim is that the extra bandwidth above 20 kHz and the finer amplitude resolution of high-resolution formats produce an improvement that listeners can hear.
- The evidence cuts both ways. In one widely cited study, a CD-quality analogue-to-digital-to-analogue loop was inserted into the playback of high-resolution recordings on high-end systems, and over more than five hundred blind trials the listeners, many of them audiophiles and audio professionals, picked the right one about half the time, which is chance Meyer & Moran, 2007. A later meta-analysis pooled eighteen studies with over twelve thousand trials and found a small but statistically reliable ability to tell the formats apart, a few percentage points above chance overall and clearer for listeners who had been trained on the task Reiss, 2016.
- The method in both cases is blind discrimination: the listener hears two versions and must say whether they differ, without knowing which is which. The disagreement is partly about material. Critics of the first study argued that many of its recordings had been mastered from 44.1 or 48 kHz sources and so contained nothing to hear; critics of the meta-analysis note that it pools studies with very different designs.
- The limits are the important part. Where a difference is found, it is tiny, it needs training to detect, and detecting a difference is not the same as preferring it. Mastering choices, loudspeakers, and the room change the sound far more than the format does.
The chapter’s account of sampling explains why. A 44.1 kHz rate already captures the audible range, and 16 bits with dither put the quantisation noise below the noise of any listening room. The real value of higher rates and depths lies in production, where headroom and processing margin matter. Recording at 24 bits is sound engineering; paying to stream at 192 kHz is mostly buying a number.
- Katz, M. (2022). Music and Technology: A Very Short Introduction. Oxford University Press. 10.1093/actrade/9780199946983.001.0001
- Jensenius, A. R. (2022). Sound Actions: Conceptualizing Musical Instruments. The MIT Press. 10.7551/mitpress/14220.001.0001
- Collins, N. (2009). Handmade Electronic Music: The Art of Hardware Hacking (2nd ed.). Routledge.
- Russ, M. (2009). Sound Synthesis and Sampling (3rd ed.). Focal Press. 10.4324/9780080926957
- Shannon, C. E. (1949). Communication in the Presence of Noise. Proceedings of the IRE, 37(1), 10–21. 10.1109/jrproc.1949.232969
- Meyer, E. B., & Moran, D. R. (2007). Audibility of a CD-Standard A/D/A Loop Inserted into High-Resolution Audio Playback. Journal of the Audio Engineering Society, 55(9), 775–779. https://aes2.org/publications/elibrary-page/?id=15249
- Reiss, J. D. (2016). A Meta-Analysis of High Resolution Audio Perceptual Evaluation. Journal of the Audio Engineering Society, 64(6), 364–379. 10.17743/jaes.2016.0015
- Müller, M. (2021). Fundamentals of Music Processing: Using Python and Jupyter Notebooks. Springer International Publishing. 10.1007/978-3-030-69808-9